


Using Indices to Catch Big Moves in Stocks
How the major indexes move and how to take advantage with swing trades

There are many different things that go into moving stock prices - flows, catalysts, fundamentals, technicals, etc.
As subscribers know, I am a huge advocate of making trading as simple as possible. It’s best to let institutions do the dirty work with extensive due diligence, because as retail traders we simply do not have the same resources and access to the same data/ research as these institutions. So how can we compete with these institutions who move stocks and have all of the best resources imaginable?
Massive advantages as retail traders include:
You don’t have to be fully invested at all times
You don’t have position size limits
You can enter/exit positions easily without worrying about liquidity
The best way to make massive gains in the market is to be conservatively aggressive. That might sound like an oxymoron, but what I mean by that is to:
Be hyper-aggressive when there are fat-pitch setups
Be hyper-conservative when stock setups are not A+
Whenever entering any aggressive position, manage risk even more aggressively
I wrote about how to manage risk down to a fraction of a percent, and how to enter a trade and make it zero-risk for each of the top 3 setups that I trade in previous newsletters:


In this Newsletter, I’ll be writing about how the indices move, the relationship of indices vs individual stocks, and how we can take full advantage of it as traders. Keeping trading simple by knowing when a breakout move can happen in the indices and knowing the overall market trend can increase success rates massively when trading individual stocks.
The S&P 500 and Nasdaq are the two indices that I watch very closely and are always on my screens when watching the market or trading during the day. To keep it simple, if the S&P/Nasdaq have a strong trend, then individual stocks are much more likely to breakout and follow-through. These indices paint the big picture of what the stock market is currently doing - are we in an uptrend? Downtrend? Consolidation/chop trend? Using this, we can plan our trades around what move the broad market is setting up for and how that can affect individual stock positions.
The indices have two different types of trends:
Consolidation/chop - this involves going sideways, slower moves, often trappy price action and fakeouts. The indices move like this about 80-90% of the time.
Directional - this involves breakouts, strong directional trends, and much cleaner price action. The indices move like this about 10-20% of the time.
In order to get the strong directional moves, the market always has to go through a consolidation/chop phase. During consolidation/chop, the indices will often build out a pattern, and once that pattern breaks it triggers a directional move.
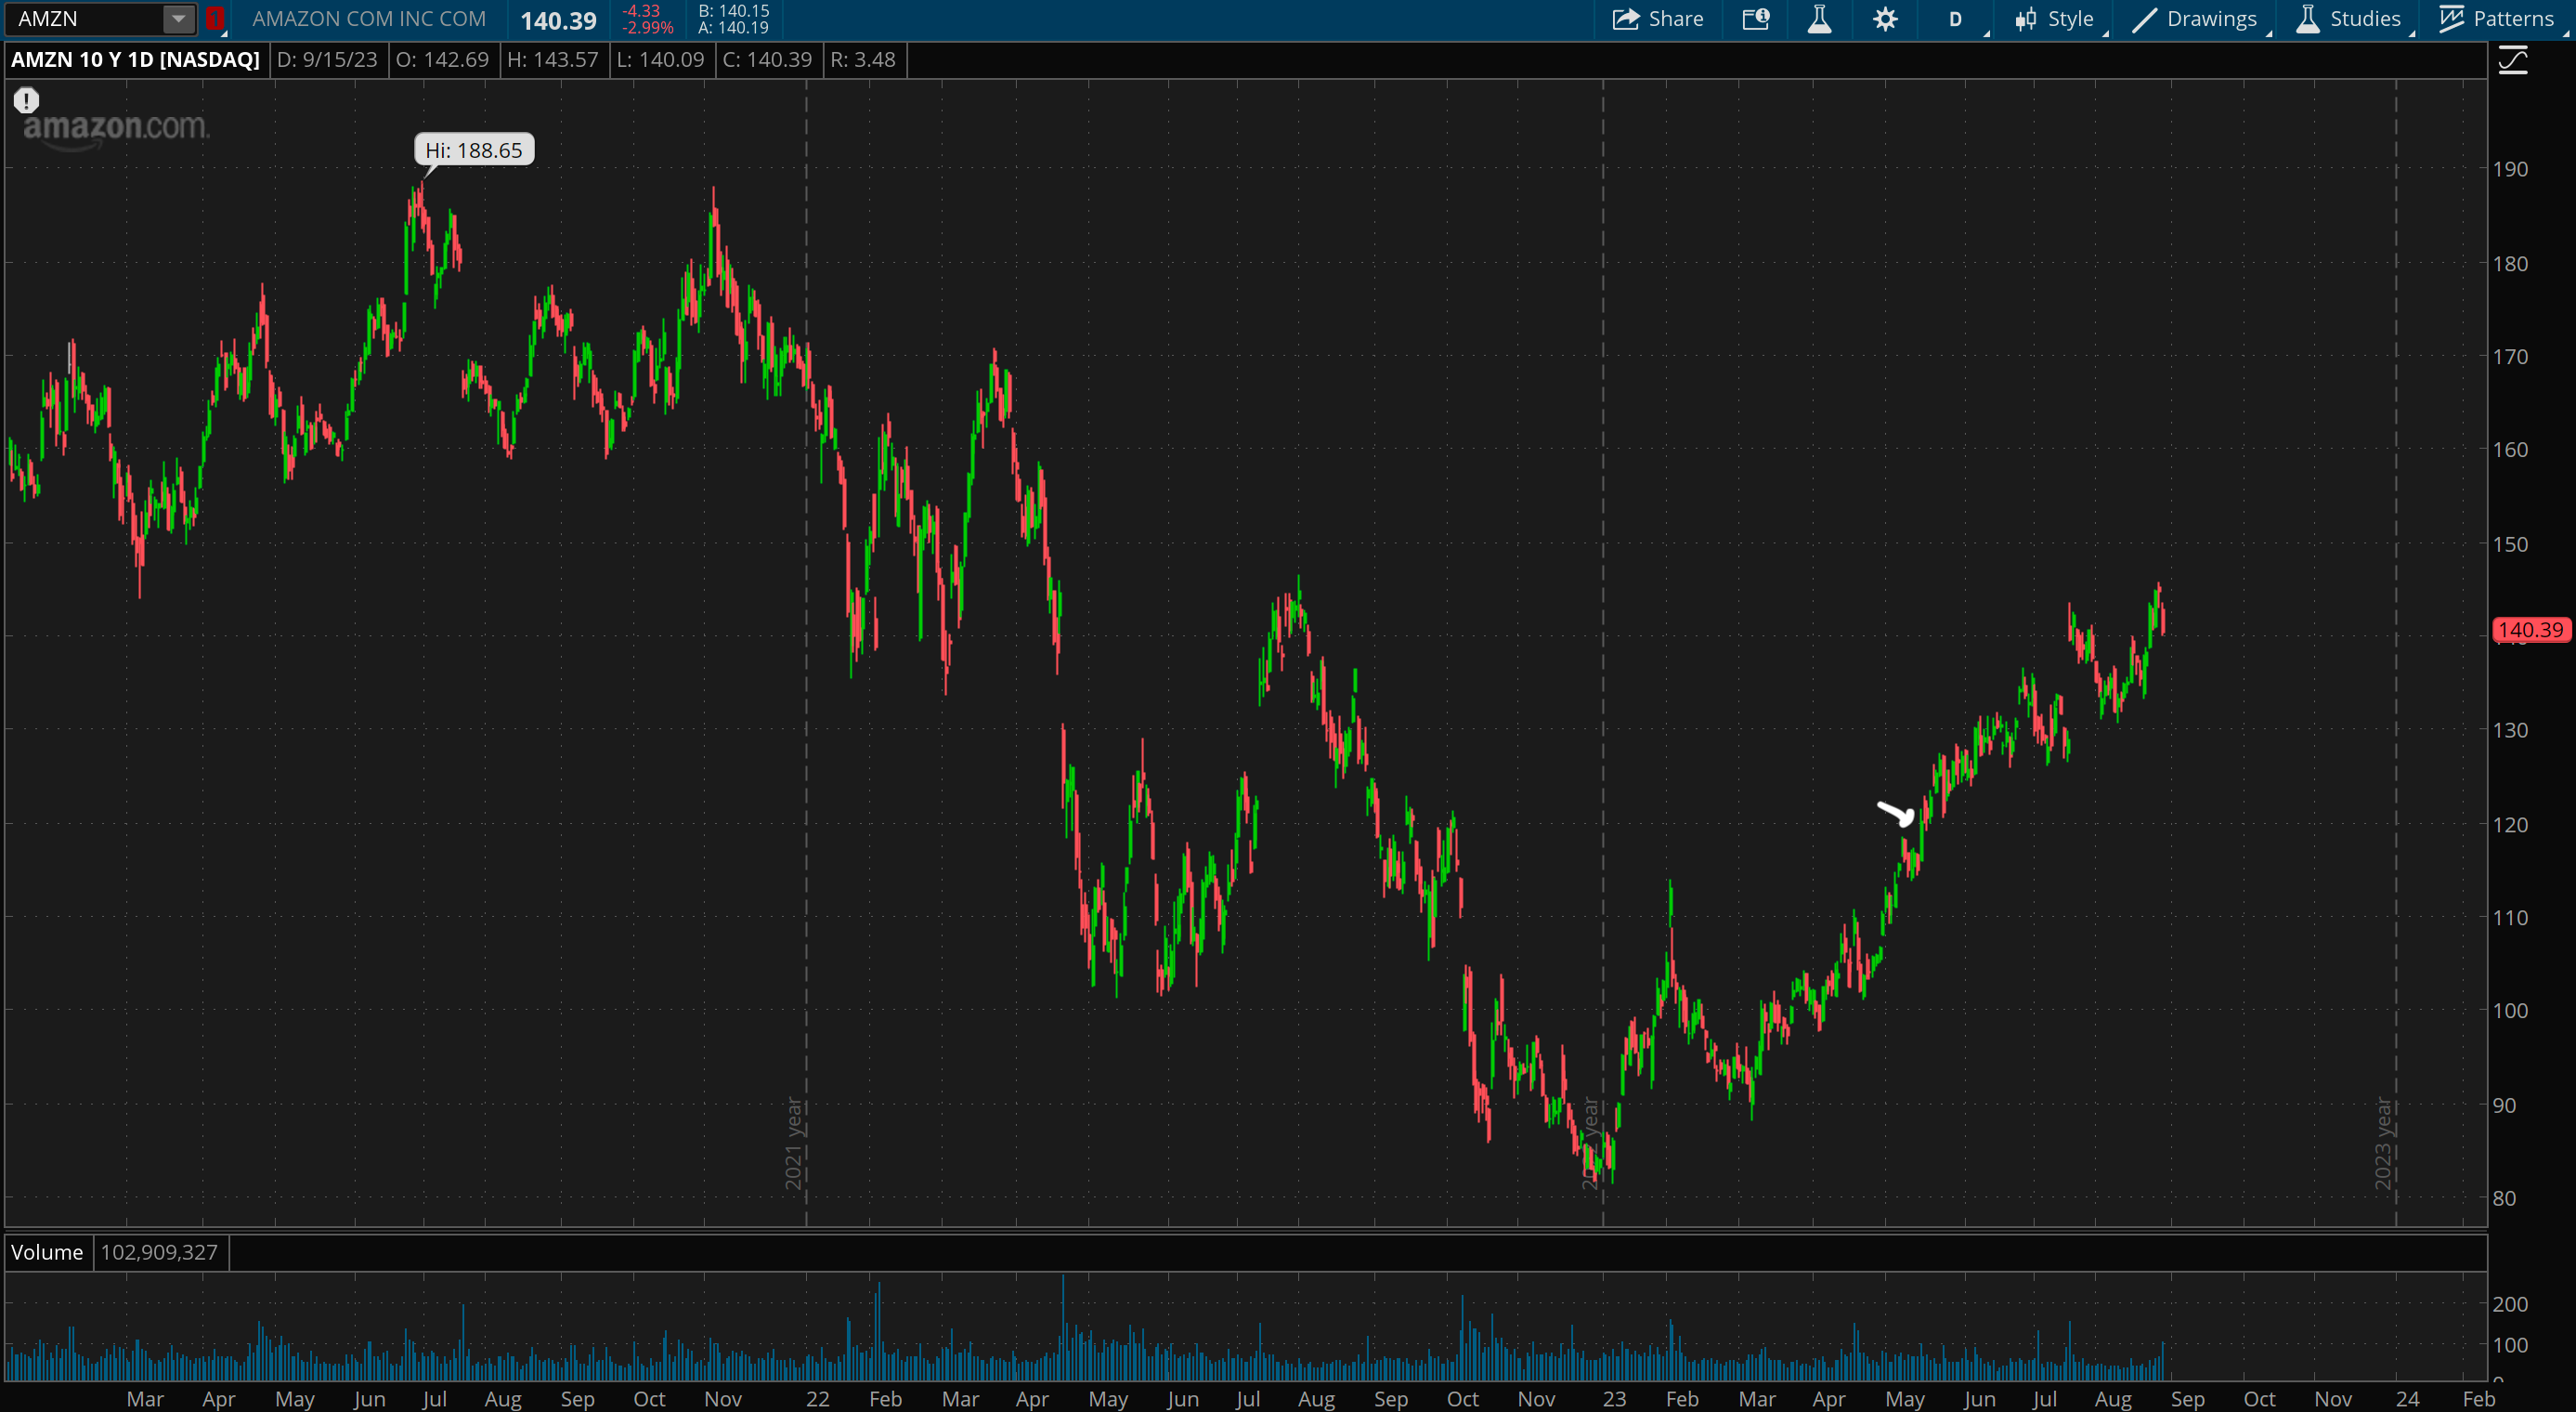
For example, from November 2022 to June 2023 the S&P 500 built out a large consolidation/chop trend which ultimately resulted in a box/range breakout. As i’ve written about in previous newsletters, the longer that a pattern is formed for, the larger the breakout will be when it plays out. This 7-month long consolidation/chop phase is a perfect example of that, as when the breakout played out, it resulted in a 10%+ move for the S&P in just 1.5 months. A 10% move may not sound like a lot, but this is absolutely massive for an index as large as the S&P (the S&P gains 8-10% per year on average - this 10% move happened in less than 2 months).

The above setup is a very large time frame example, but these chop/consolidation trends happen all the time on small time frames. You will often see indexes consolidating tightly for 3-5 days, and then the breakout only lasts 1 day but it’s a strong 1%+ directional move in result.
For example, recently the S&P built out a tight 4-day consolidation zone from 8/30-9/05 with $4493-4500 as the key support/pivot zone. It broke below on 9/06, triggering the breakdown and resulting in a strong 1% sell.

These small time frame examples wouldn’t be something that I trade for anything more than a quick day trade/scalp (and would be low conviction trades), but overall just shows how these consolidation/ chop trends will always result in a directional move.
The larger consolidation/chop trends are what traders should focus on for successful swing trade setups in individual stocks. In the above example of the 7-month long consolidation and breakout for the S&P, it is no coincidence that individual stocks made major upside moves in result. Here is the list of the top 10 holdings in the S&P:

Many of these stocks broke out of bases at the same time as the S&P which triggered legs higher. These could have been very simple and easy trades along with the index breakout to ride the trend:


There are many smaller-cap & high beta stocks that made much larger moves along with the indices as well. When indices breakout of large consolidation/chop patterns, it strengthens the thesis that much more as you have the broad market upside, bullish sentiment increasing, and the individual stock setup all working together.
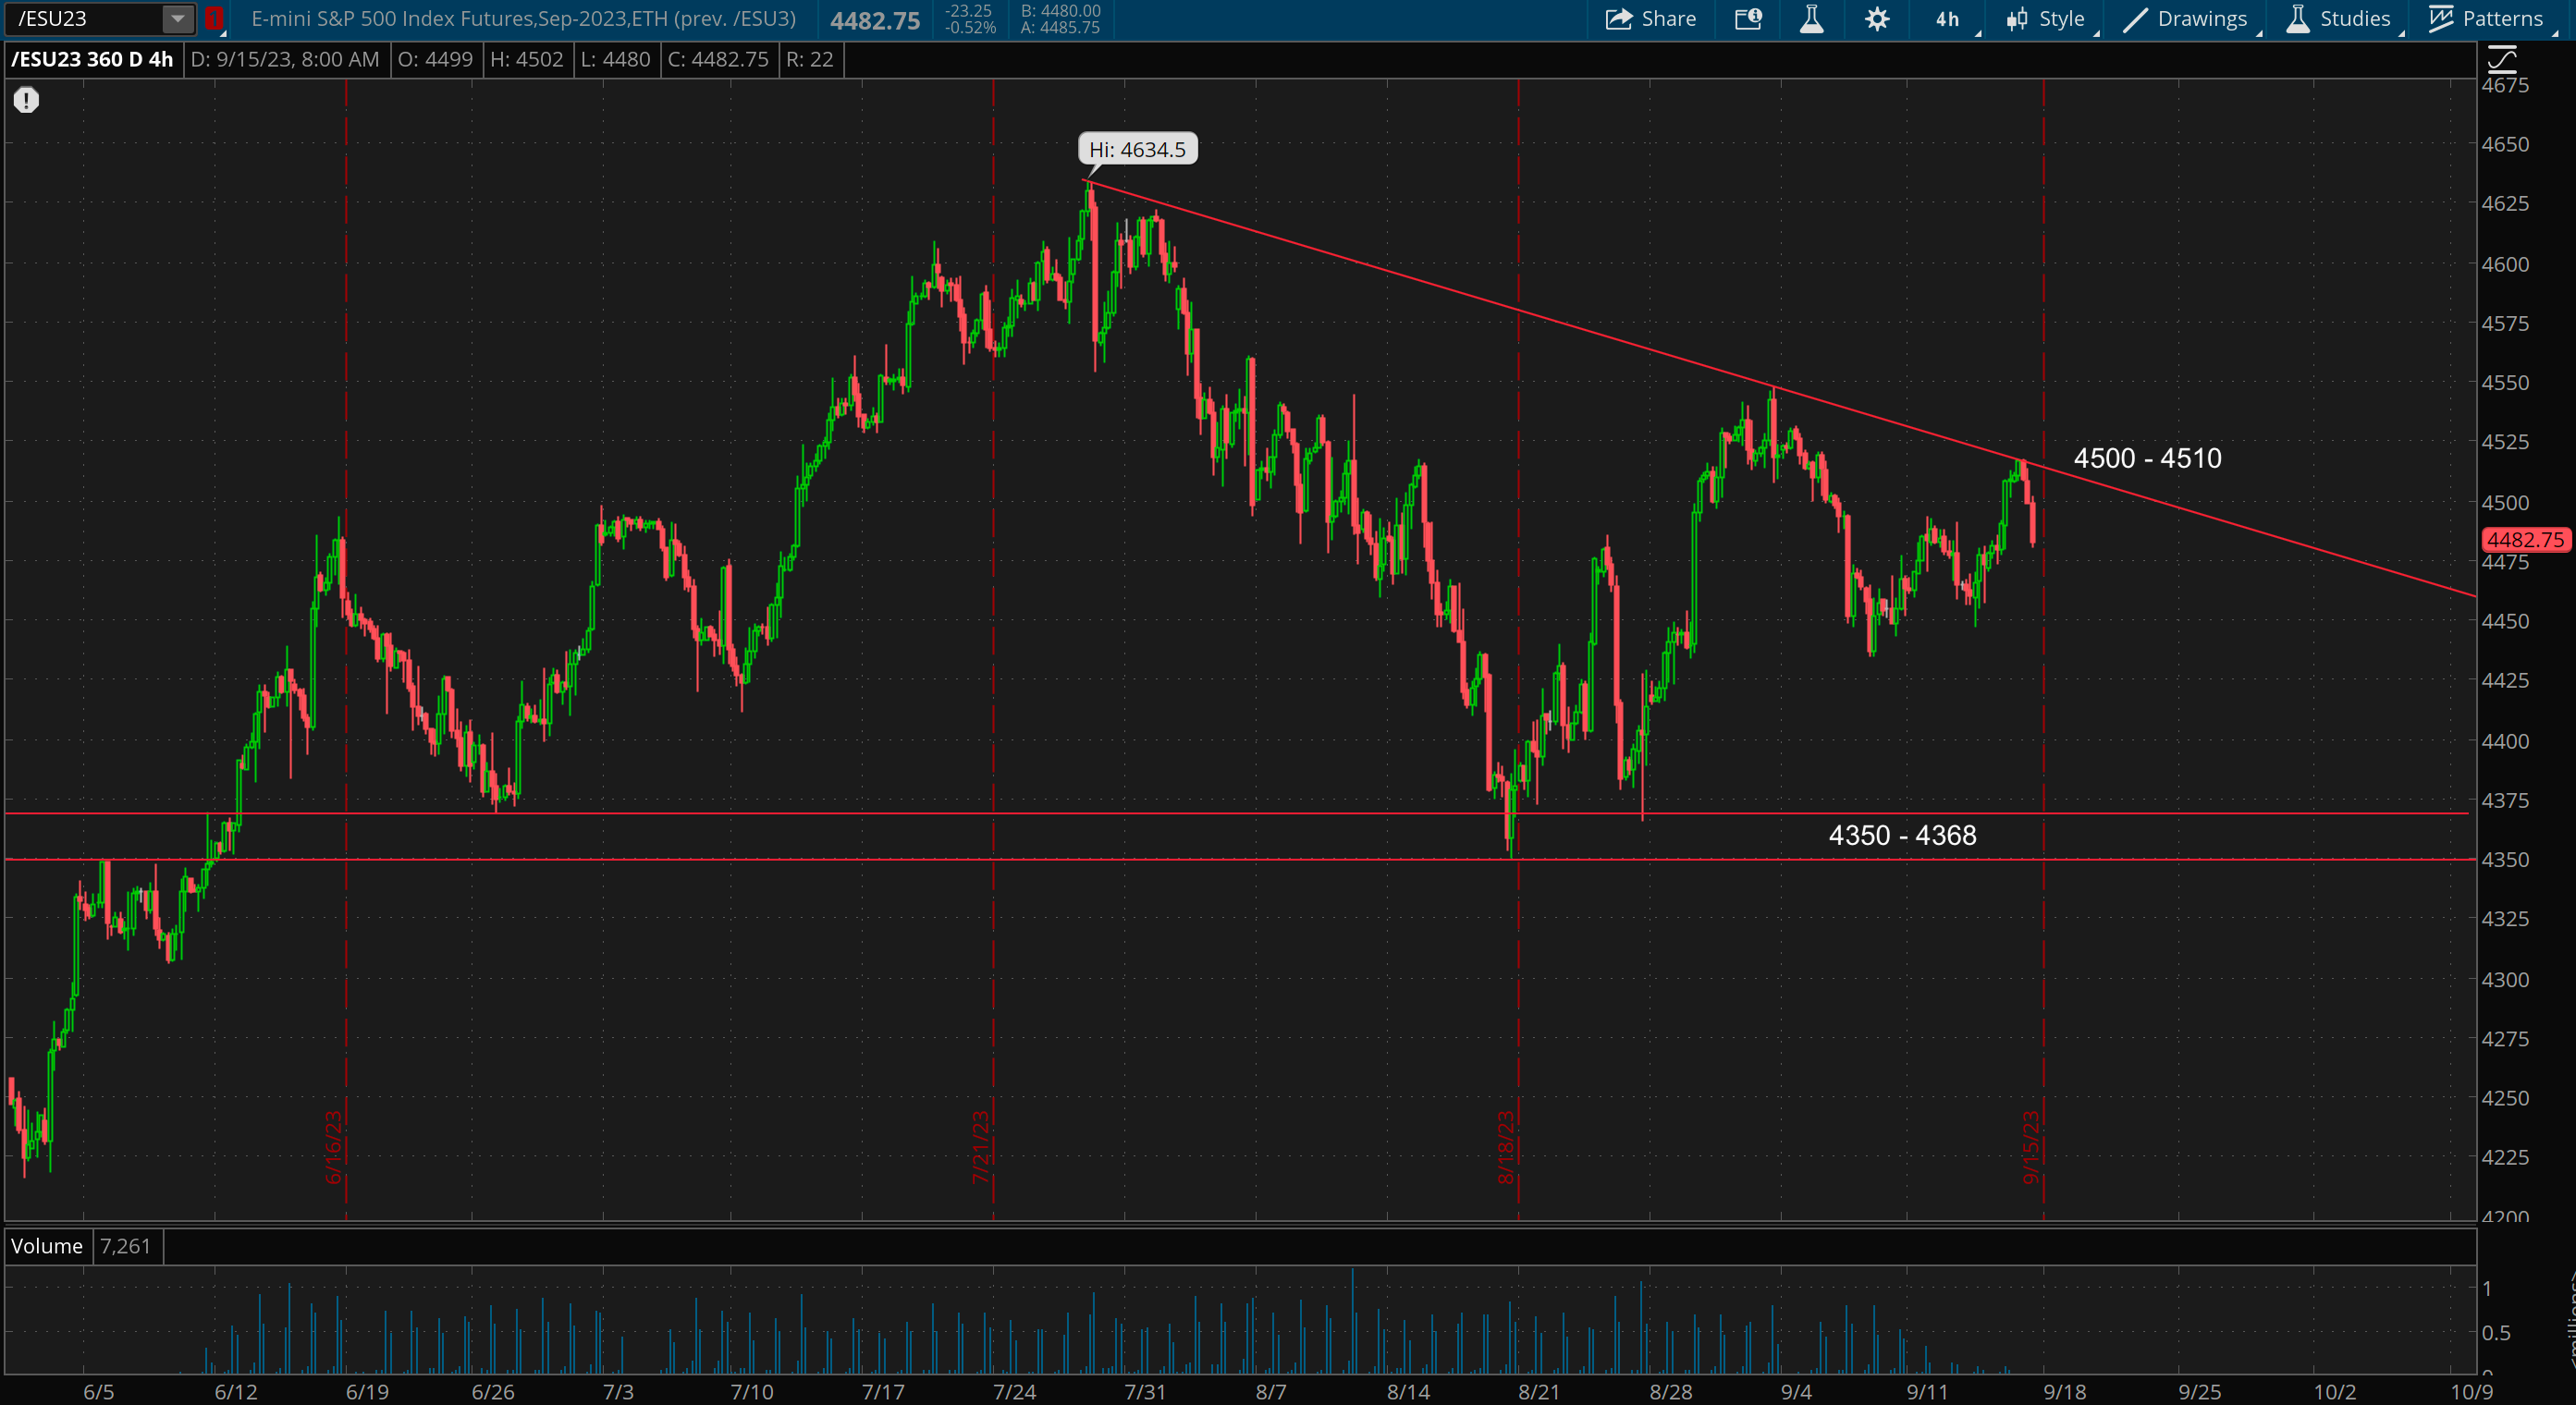
The S&P has currently been building out a large pattern that has been forming since 6/12 (3+ months) - this will resolve in a large directional move for the market once it breaks. There are two main different patterns within this broader consolidation/chop trend. The first is a descending triangle, if it breaks out on the upside it will involve breaking above the trendline resistance which is currently at 4500-4510, and is tradeable using the trendline breakout. If it was to break to the downside, breaking below 4350-4368 would trigger the breakdown (breakout to the downside) and likely lead to a retest of 4180-4200 as support (previous breakout zone from the 7-month consolidation).
Note: I am using the Septmber futures contracts with these levels, if using the December contract levels will need to be adjusted.
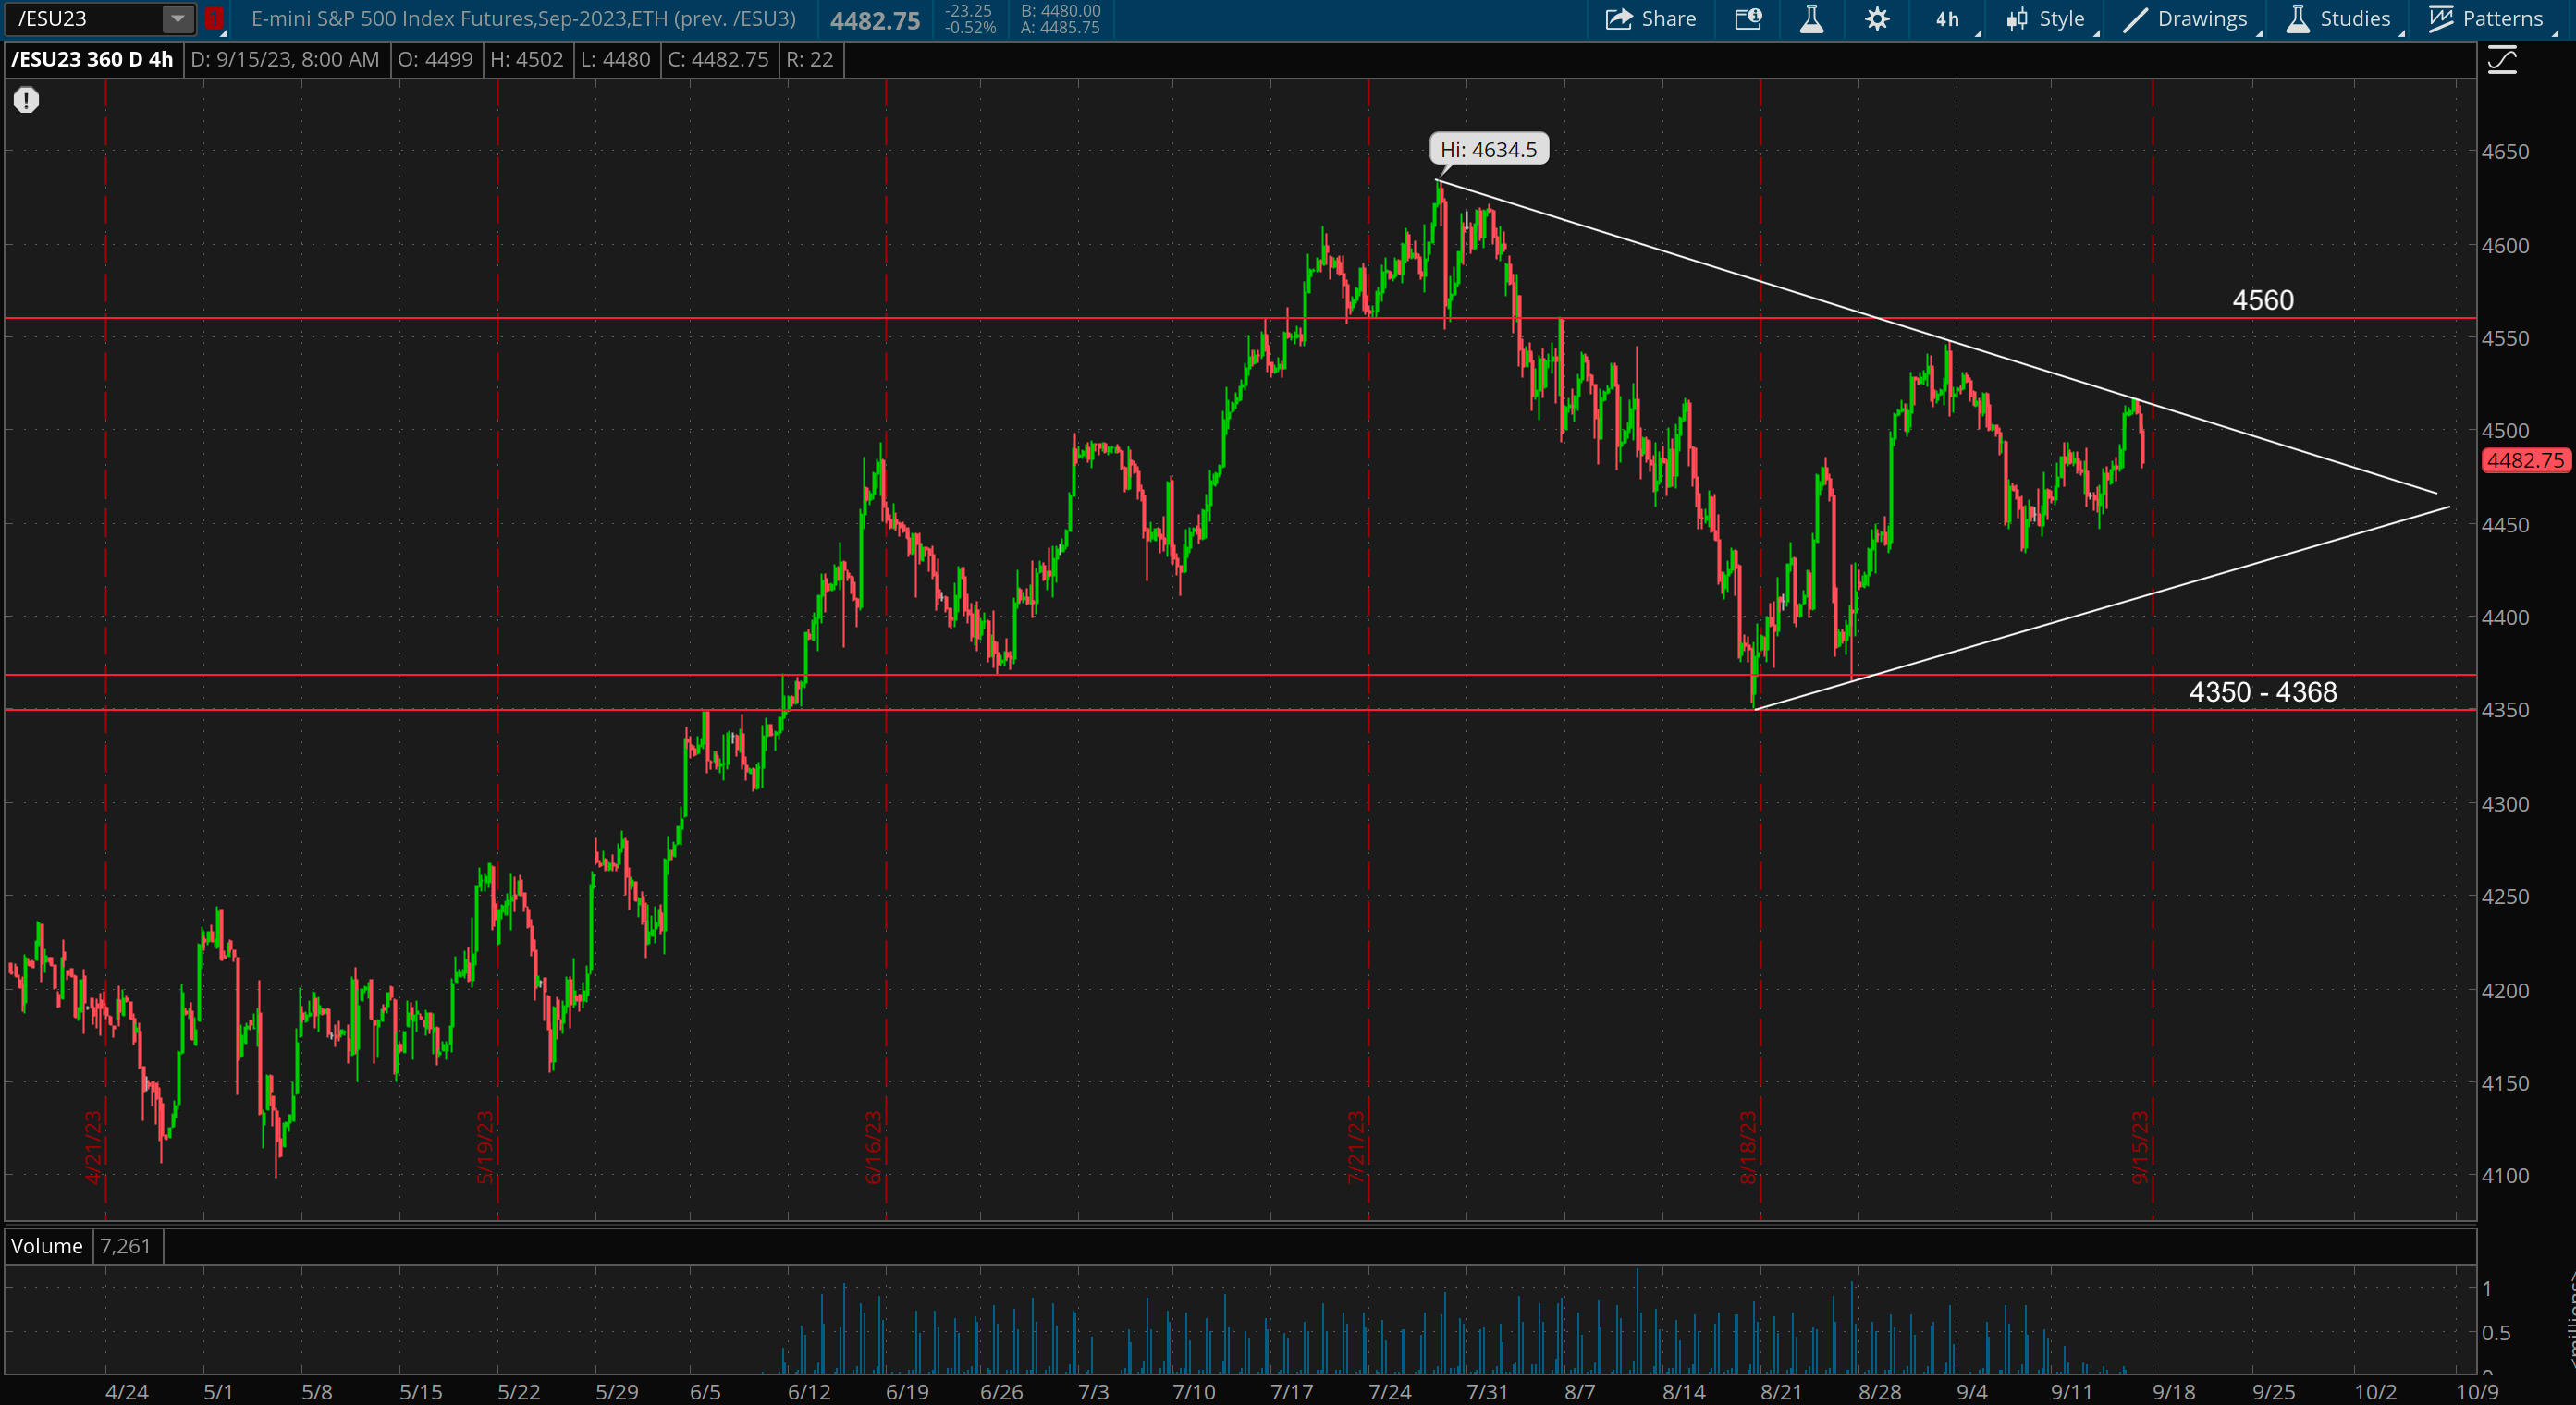
This pattern could also be looked at as a wedge which is a pattern with two trendines where price is making lower-highs and higher-lows. the trendline resistance is the same as above, and the trendline support is currently at 4412-4422. Whichever trendline is broken will likely result in a strong directional move.

The initial target level that I’d be looking for if broken to the upside would be 4560 where breaking above there would open upside back to recent highs. If broken to the downside, the 4350-4368 zone would be key and breaking below there would start that real breakdown and leg lower for the market.
My personal lean would be that this ends up breaking out to the upside, but of course as traders our job is only to react, and not predict. Trading breakouts on the upside is the preference though and has higher odds of doing so, supply/demand dynamics gives the edge to buyers and as we know, stocks go up over time. In a broader uptrend, when breakdowns happen they will often turn into false-breakdowns which would also be a conviction trade opportunity if that was to play out.
A few setups that I’m watching closely and will likely breakout in unison with the S&P if the upside scenario plays out are AMZN 0.00%↑ and CVNA 0.00%↑.
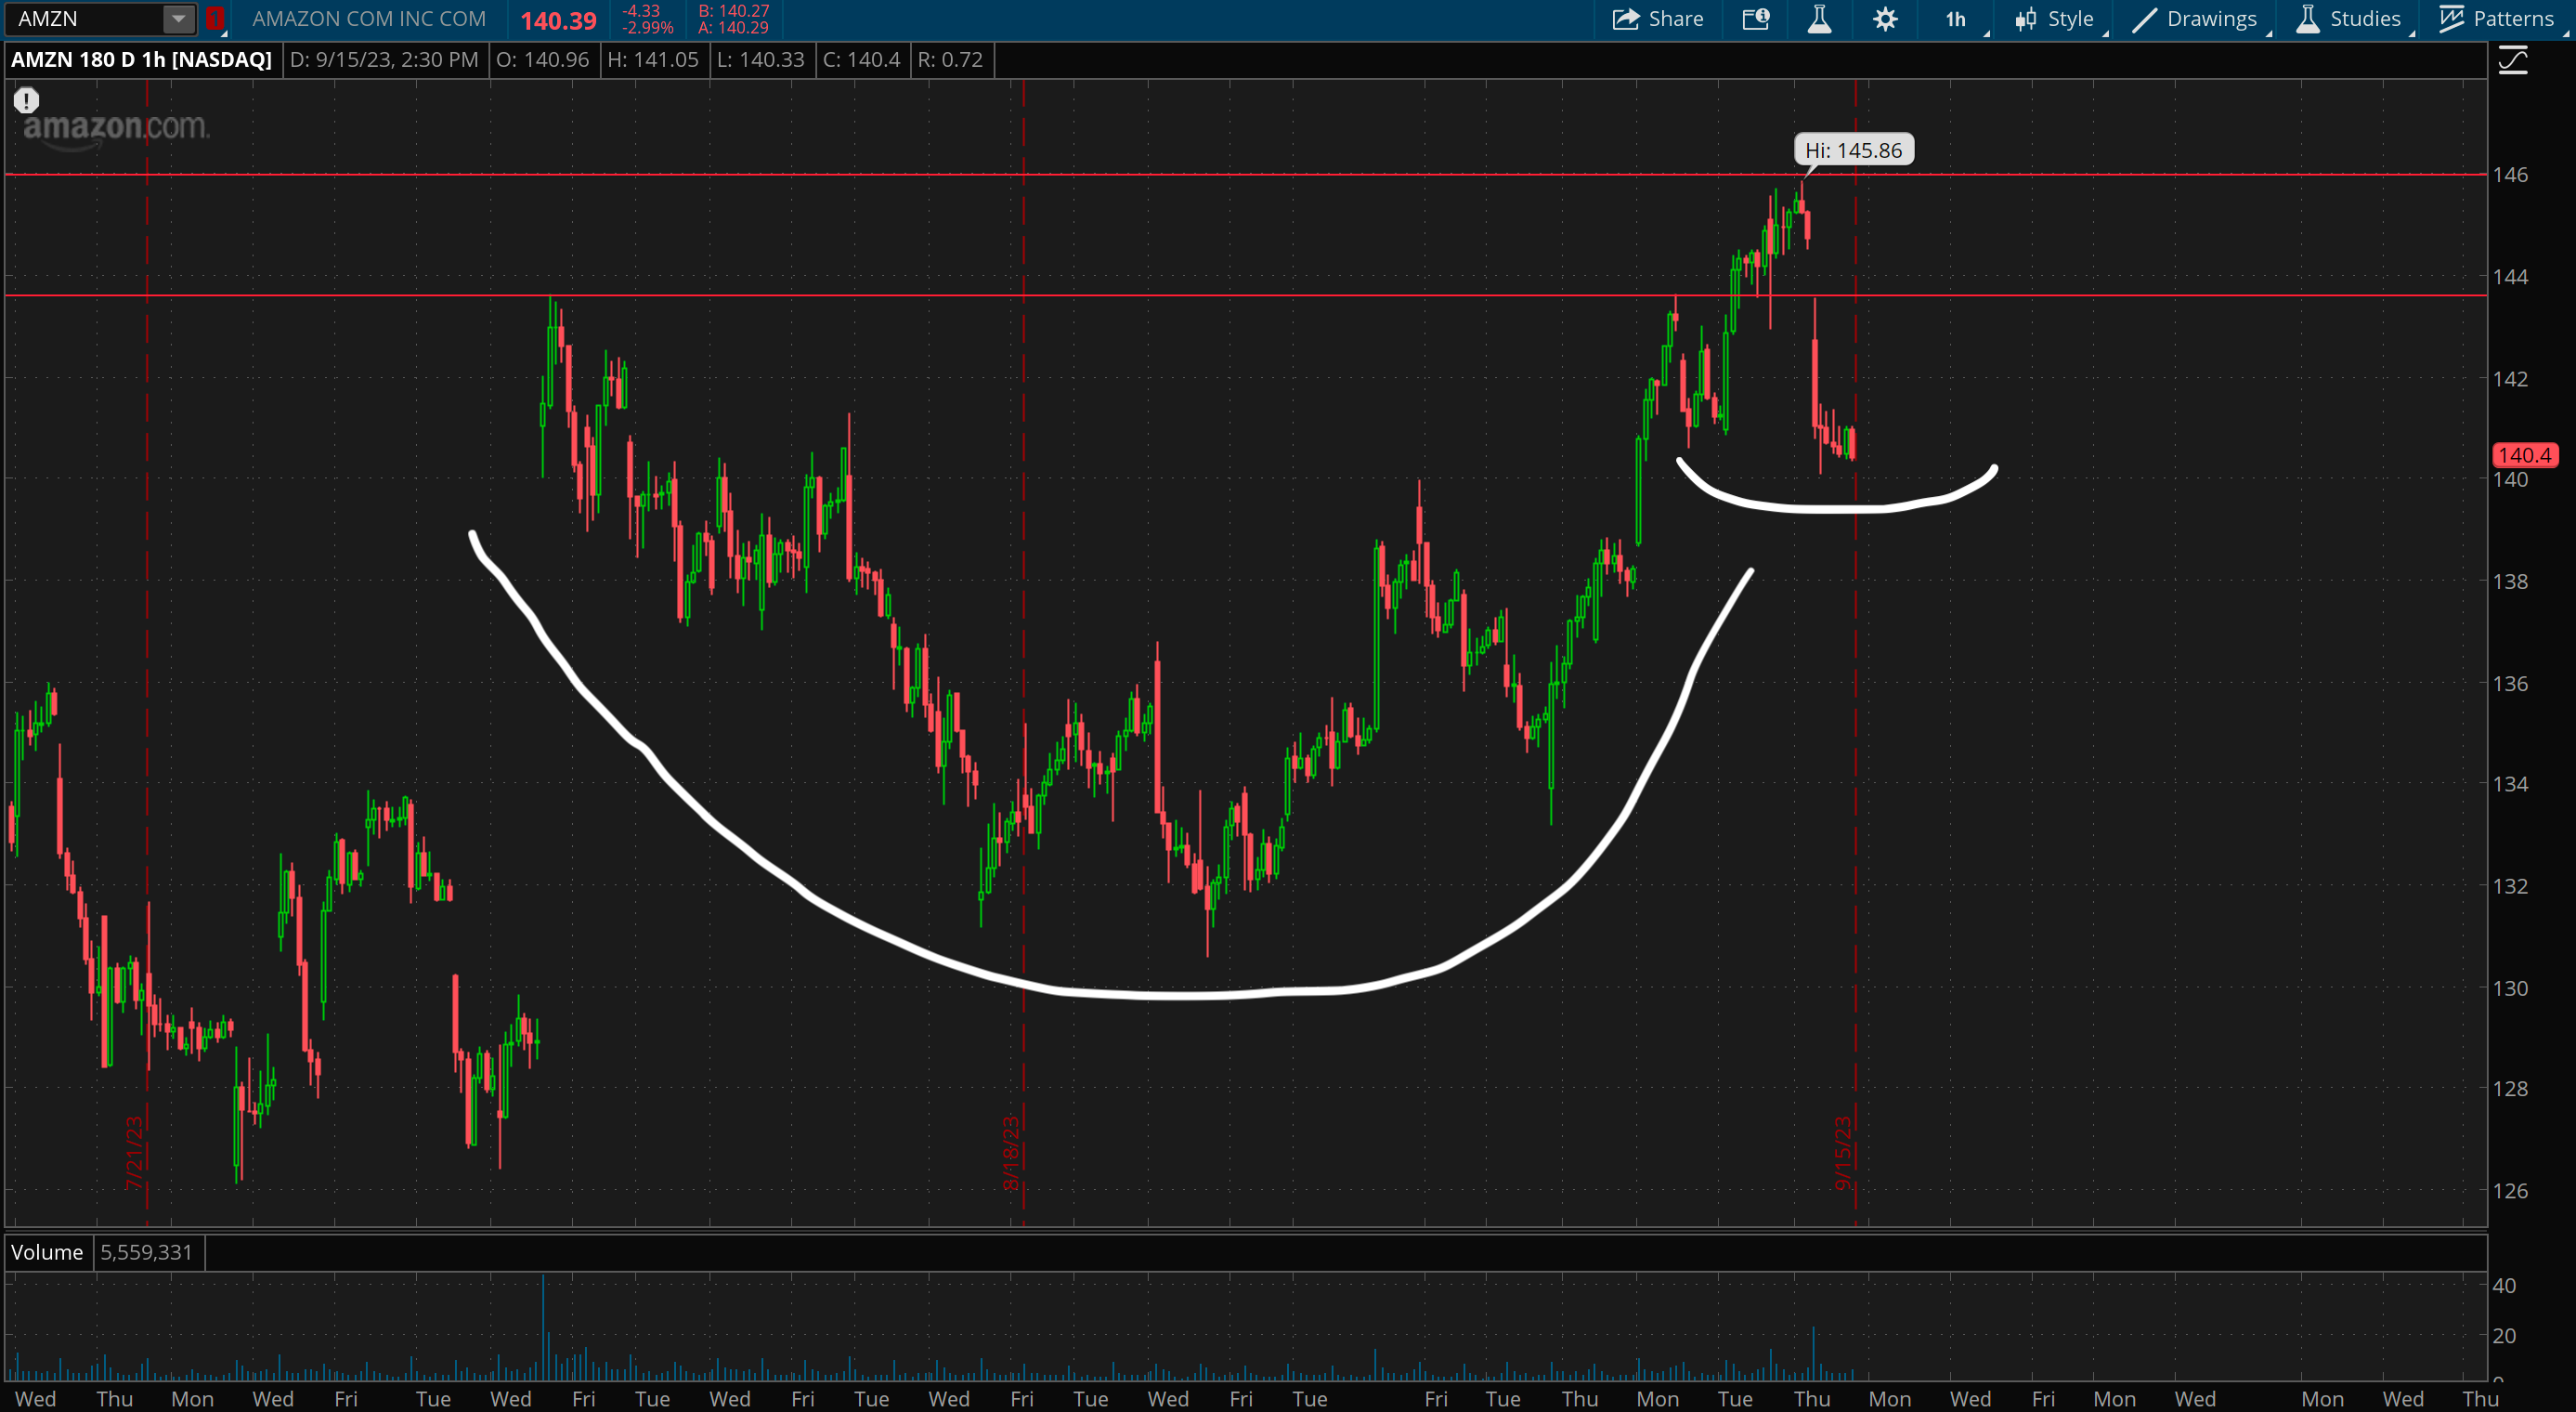
AMZN 0.00%↑ is consolidating right below $143.6-145.95 which is a major resistance and historical pivot zone as shown below.

If the S&P breaks above the trend line resistance at the same time as AMZN 0.00%↑ breaks above this pivot zone, that would be an A+ long setup for me and tradeable using the box/range breakout strategy.
Zooming in to smaller time frames, AMZN 0.00%↑ has also built out a small cup & handle pattern which only increases the conviction of this potential breakout setup.
CVNA 0.00%↑ is setup in this 1+ year long base pattern which has also formed a cup & handle. The key resistance zone is at 57-58.25 which breaking above would trigger the breakout.
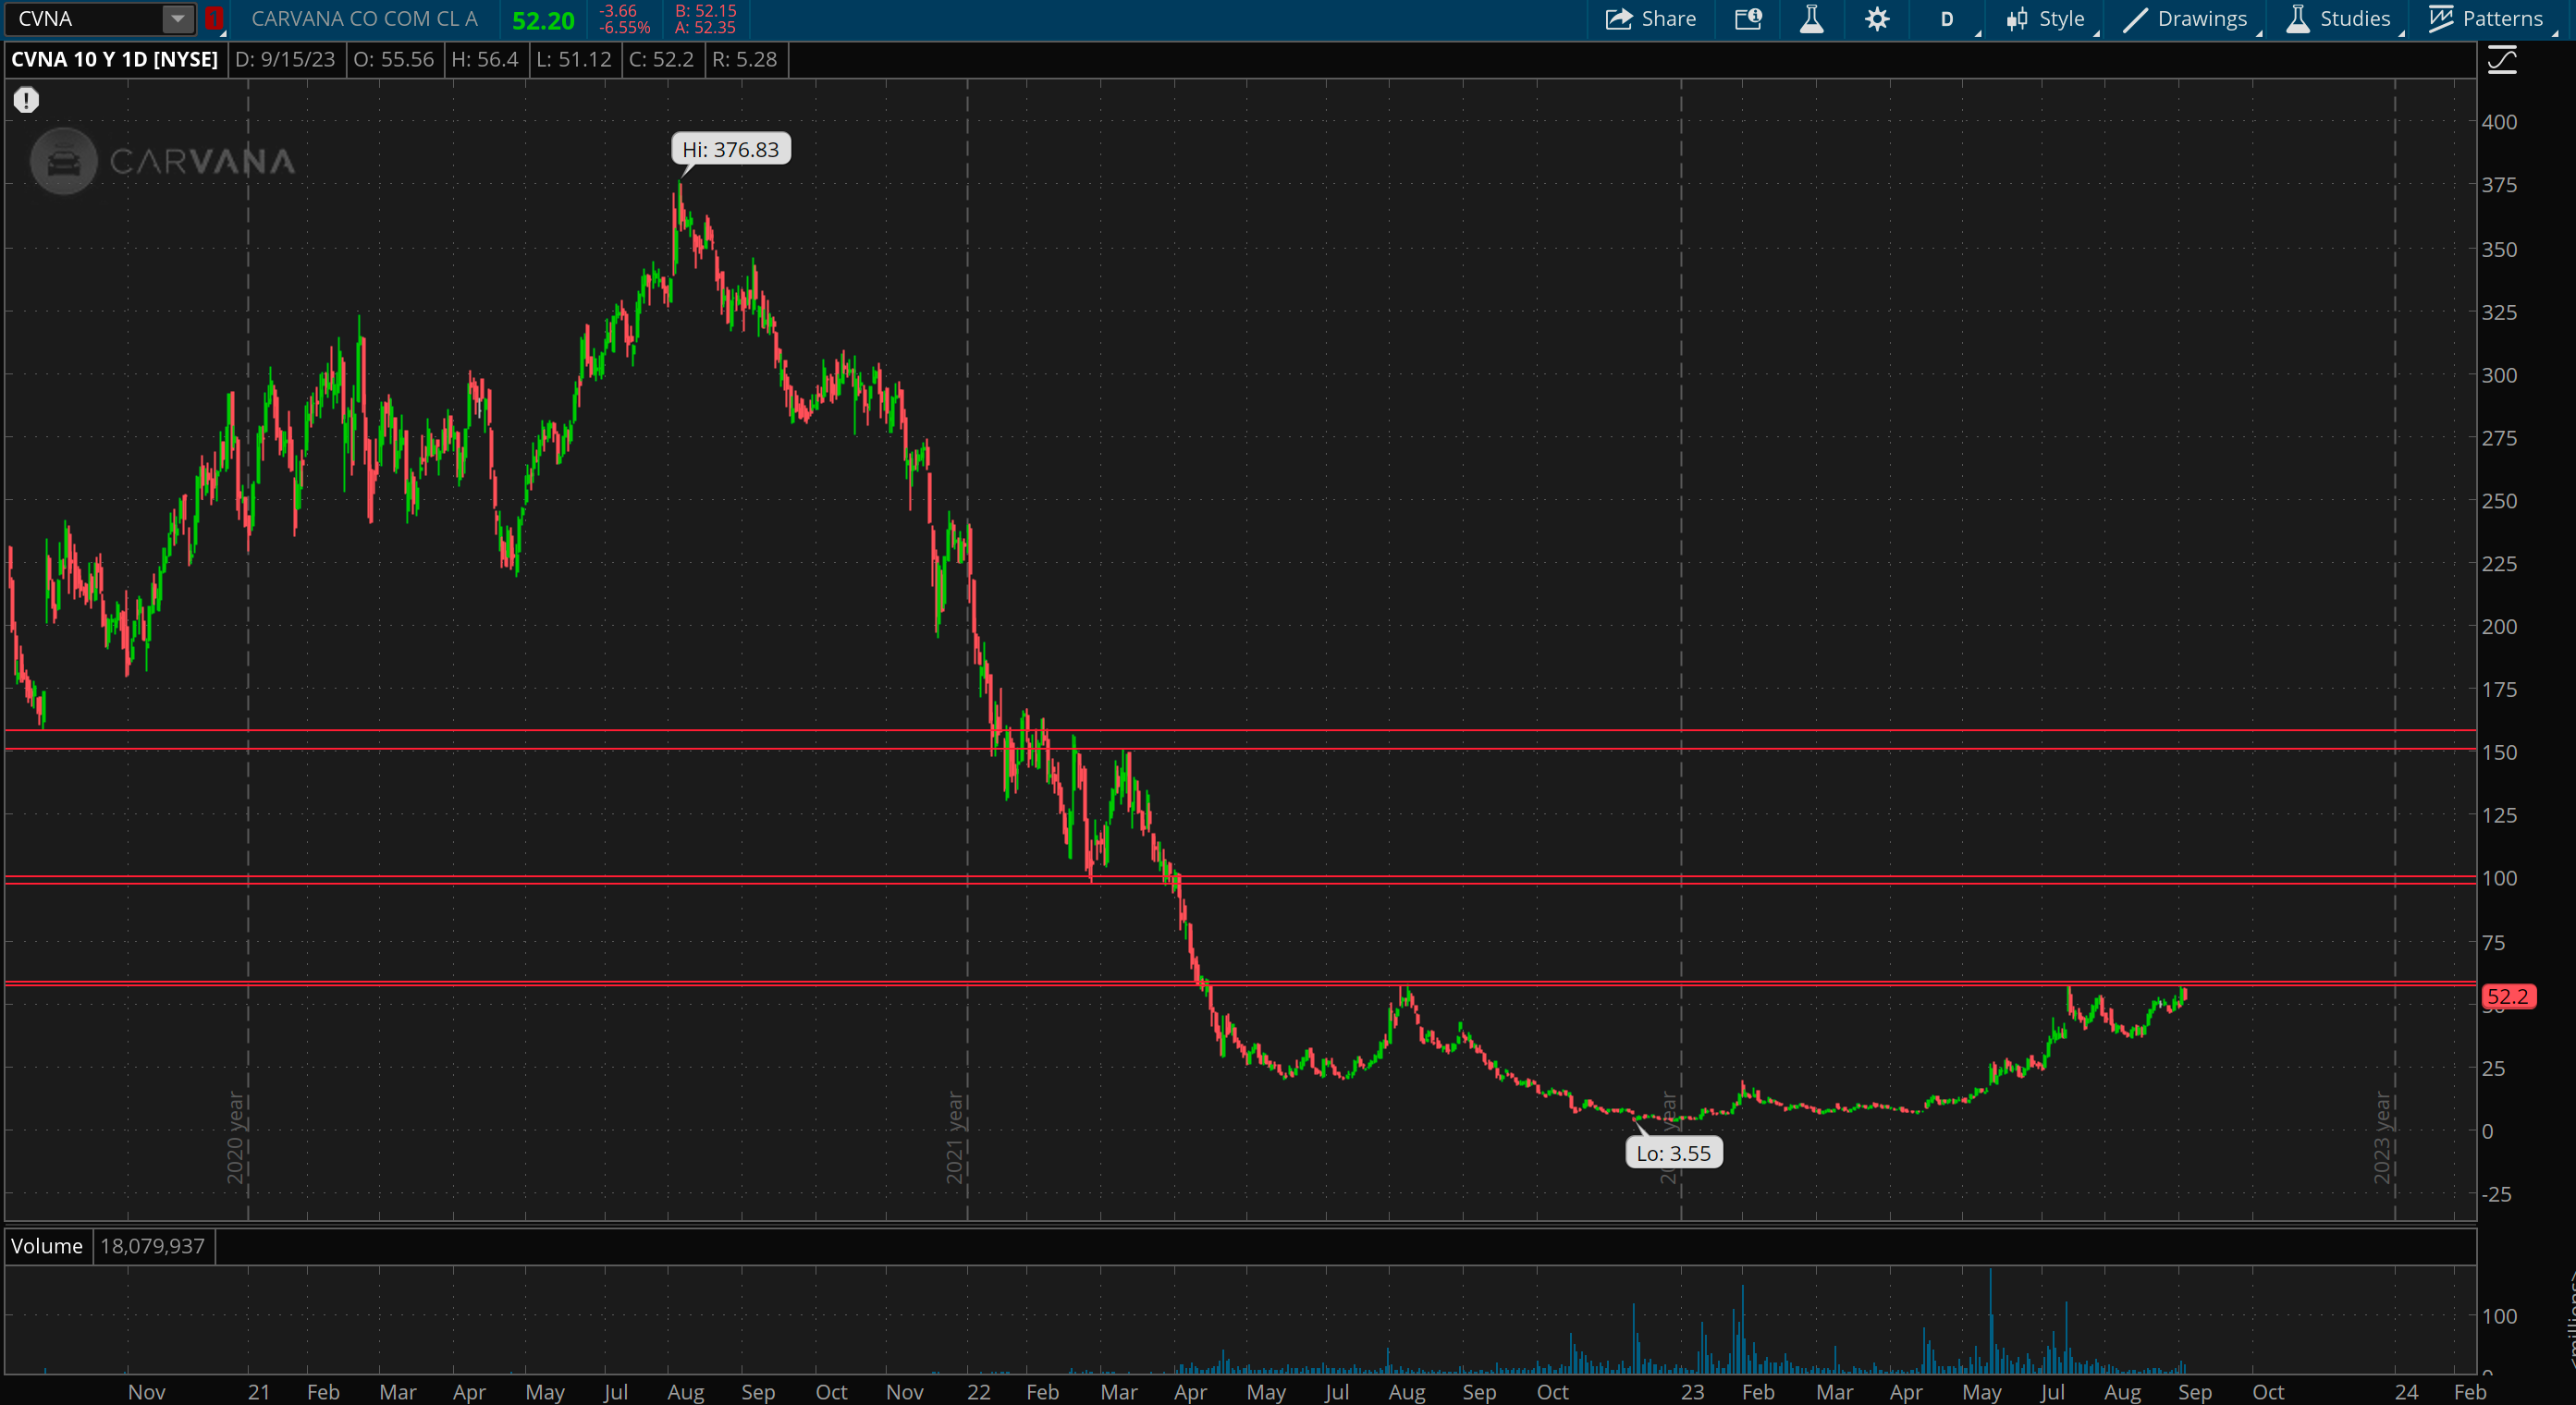
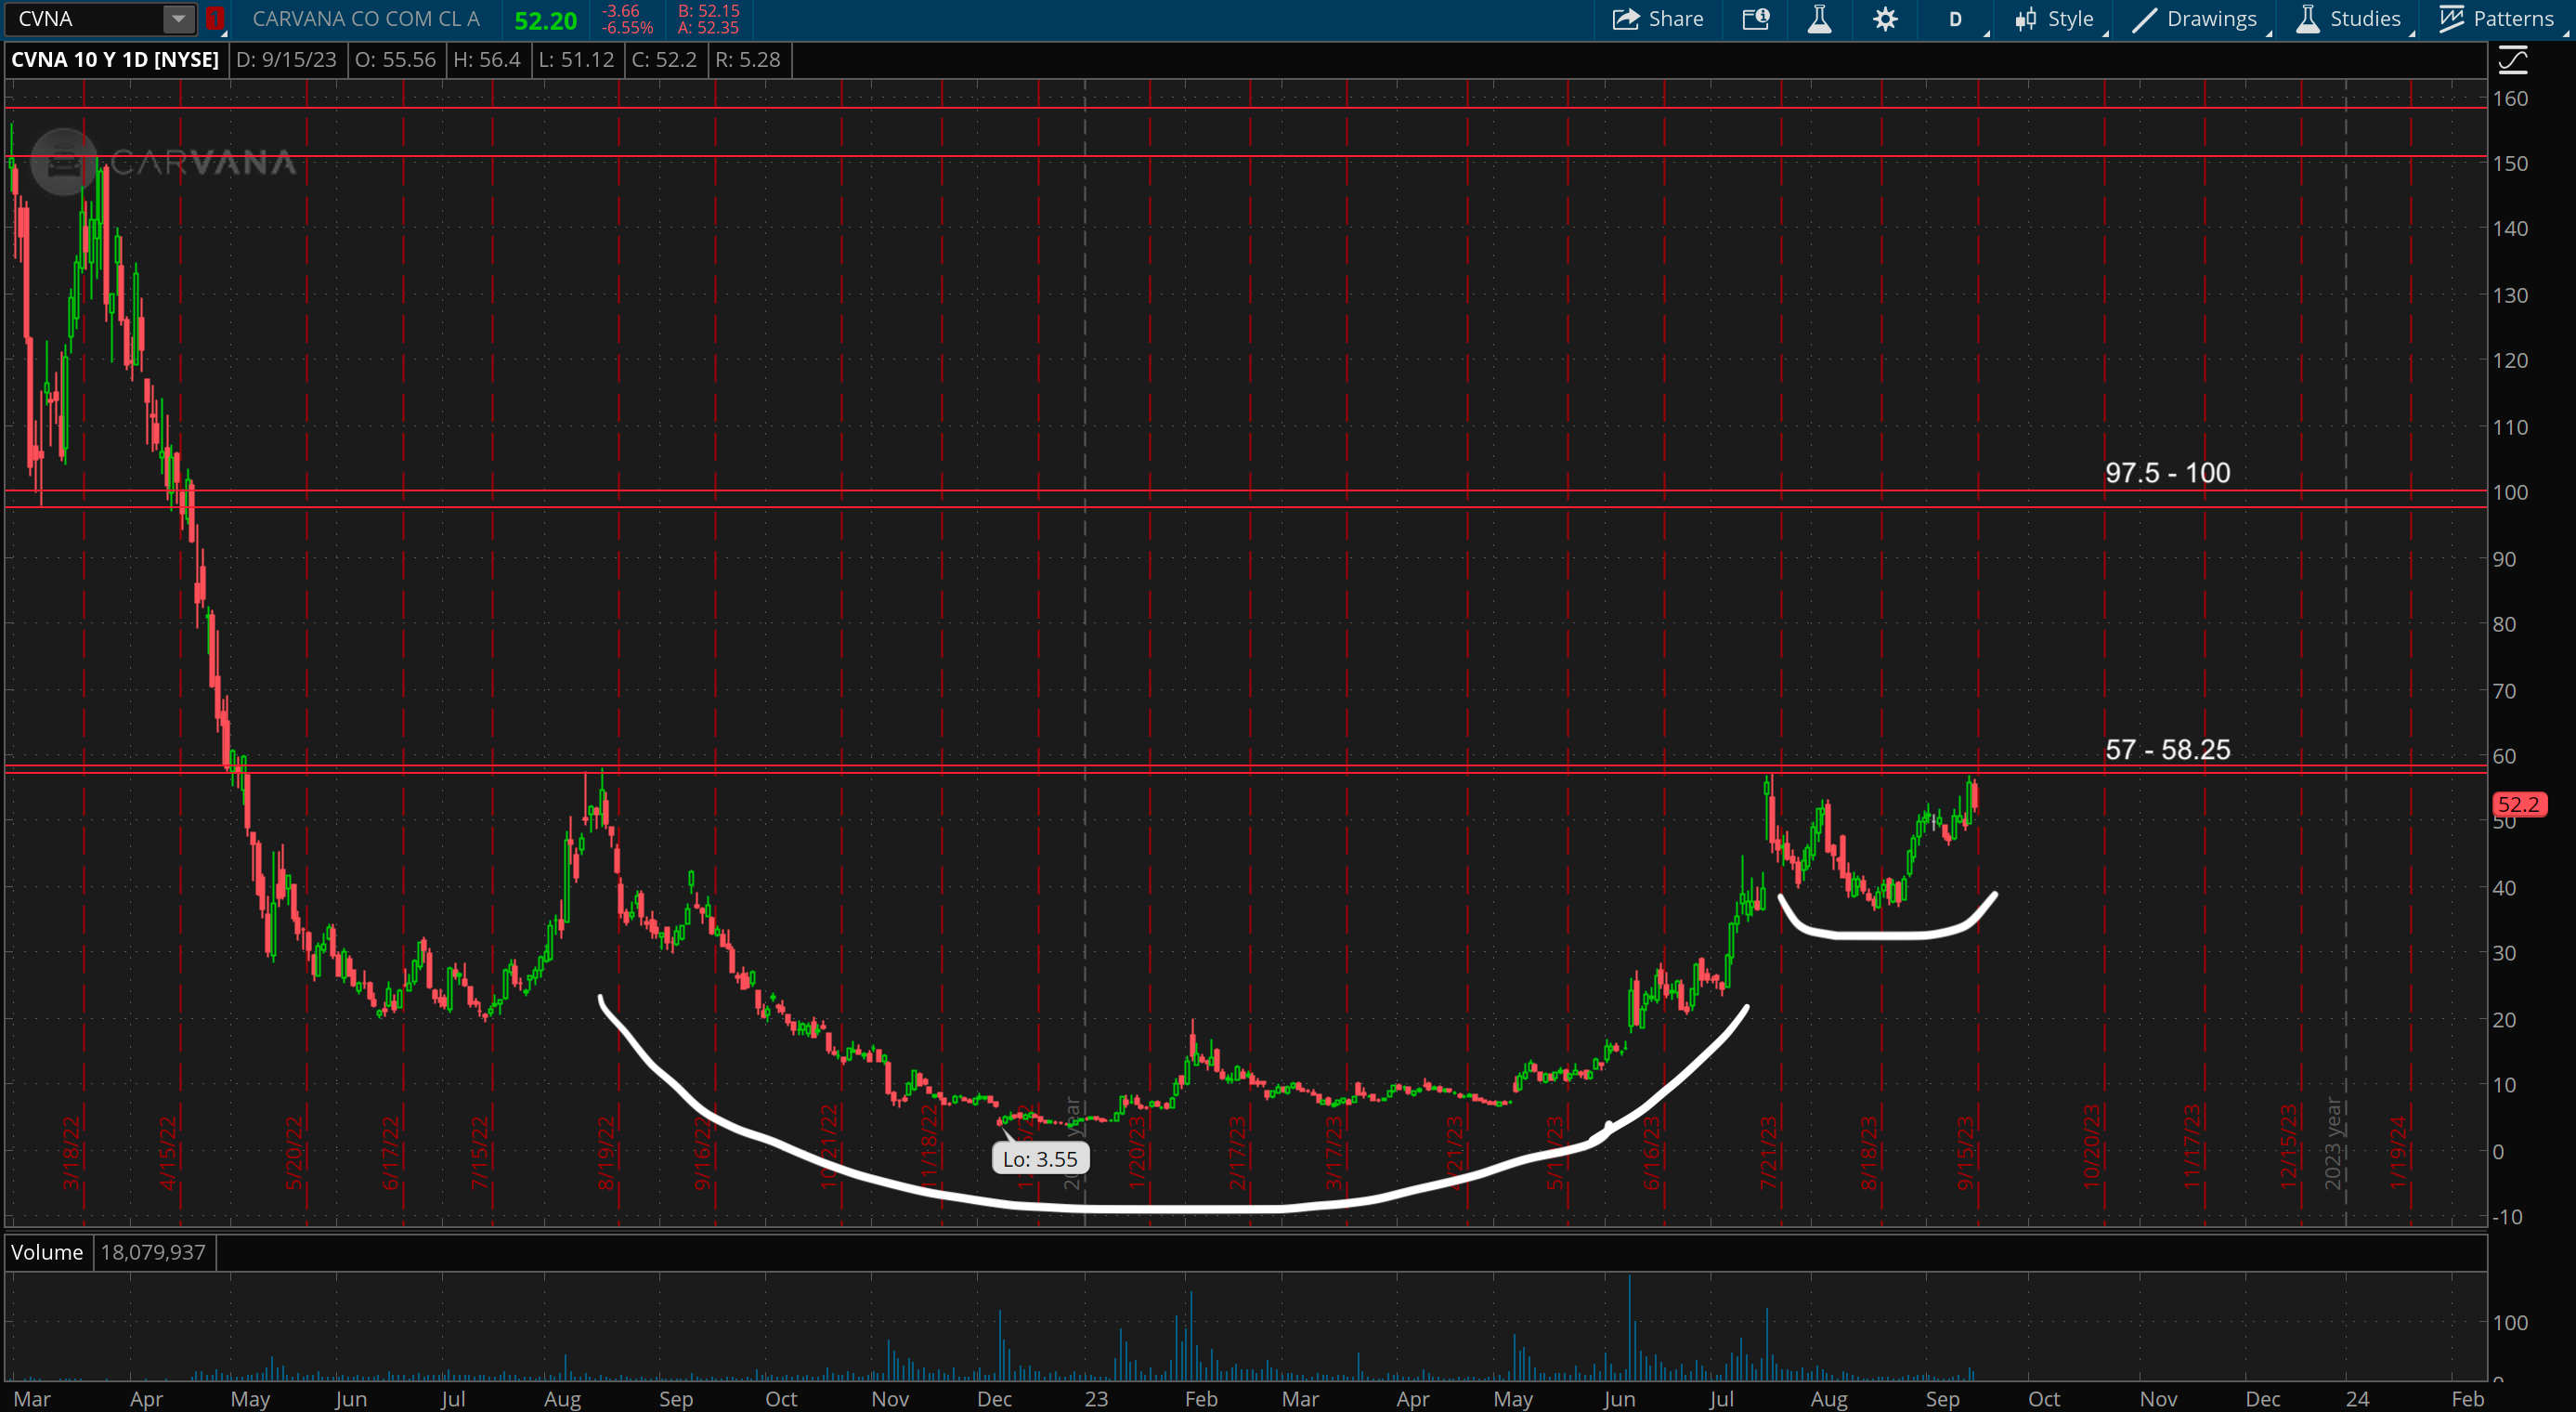
The main target zone above would be 97.5-100 which would be a 70% upside move from the breakout, and using the box/range breakout this setup offers A+ risk/reward. Buying above 58.25 and playing a stop loss back below 57 would be less than 3% risk with obviously massive upside potential. Breaking out along with the indices would of course only strengthen the thesis of this potential breakout trade as well.
Similar to AMZN, CVNA also has a smaller pattern within the broader setup as it’s built out this inverse head & shoulders just below the key resistance/breakout zone. This is all tradeable using the range/box breakout strategy, and clean and long setups like this are exactly what you want to look for when the indices are gearing up for a large directional move.
