


Trading the Box/Range Breakout

In last newsletter, I wrote about the trendline breakout: a simple, low-risk/high-reward setup to trade. In this newsletter, I will be going over the other most common setup that I trade: the box/range breakout.
The box/range breakout is another simple, low-risk/high-reward setup to trade. Like I preach, simplicity is always best in technical analysis. It is the most simple patterns that have the highest win rate, and that are the easiest to manage risk on.
What is the box/range breakout?
This is arguably the most simple technical pattern. It involves a well defined horizontal resistance level/top of the range, where a break above the level triggers a breakout. Often times, this will form a ‘box-like’ structure where there is a well defined horizontal support at the bottom of the range as well. This pattern can also referred to as a base or flag.
There are a lot of similarities with the trading strategy of the box/range breakout and trendline breakout. In my experience, the trendline breakout will often produce a more explosive move higher, though the box/range breakout is much easier to manage risk on.
Personal trading rules that I have for the box/range breakout:
Do not enter if it’s a weak breakout candle
When up 10% or more on a position, put a stop loss at breakeven
If it’s not a ‘high conviction’ position, take some profit off the table at/near 10% gain
Sell immediately on a daily close back below the breakout level
Always be aware of catalysts and hedge/wait to enter accordingly (earnings reports, investor conference, etc)
As you can see, trading rules that I have with this pattern are pretty much the exact same as the trendline breakout. The only difference is instead of having a stop loss back below a descending trendline, you have a stop loss below the horizontal breakout level which makes it easier to set risk. If entered correctly, you can manage risk down to a fraction of a percent if you’re looking to trade with very tight risk - buy right when the breakout happens, and have a stop loss slightly below the breakout level. Having that tight of a stop will have a lower win rate and often result in multiple stop-outs, but if you’re risking just 1% or a fraction of 1% per trade, it will result in many profitable trades. For example, if you’re risking 1% per trade and your average gain is 10%, you could have a 1:10 win to loss ratio and still be breakeven.
A couple important things to note:
The longer and tighter that a consolidation is, the stronger/larger that the breakout will be
The most well-defined/respected resistance levels will have the highest win rates on breakouts
Let’s take a look at some examples:
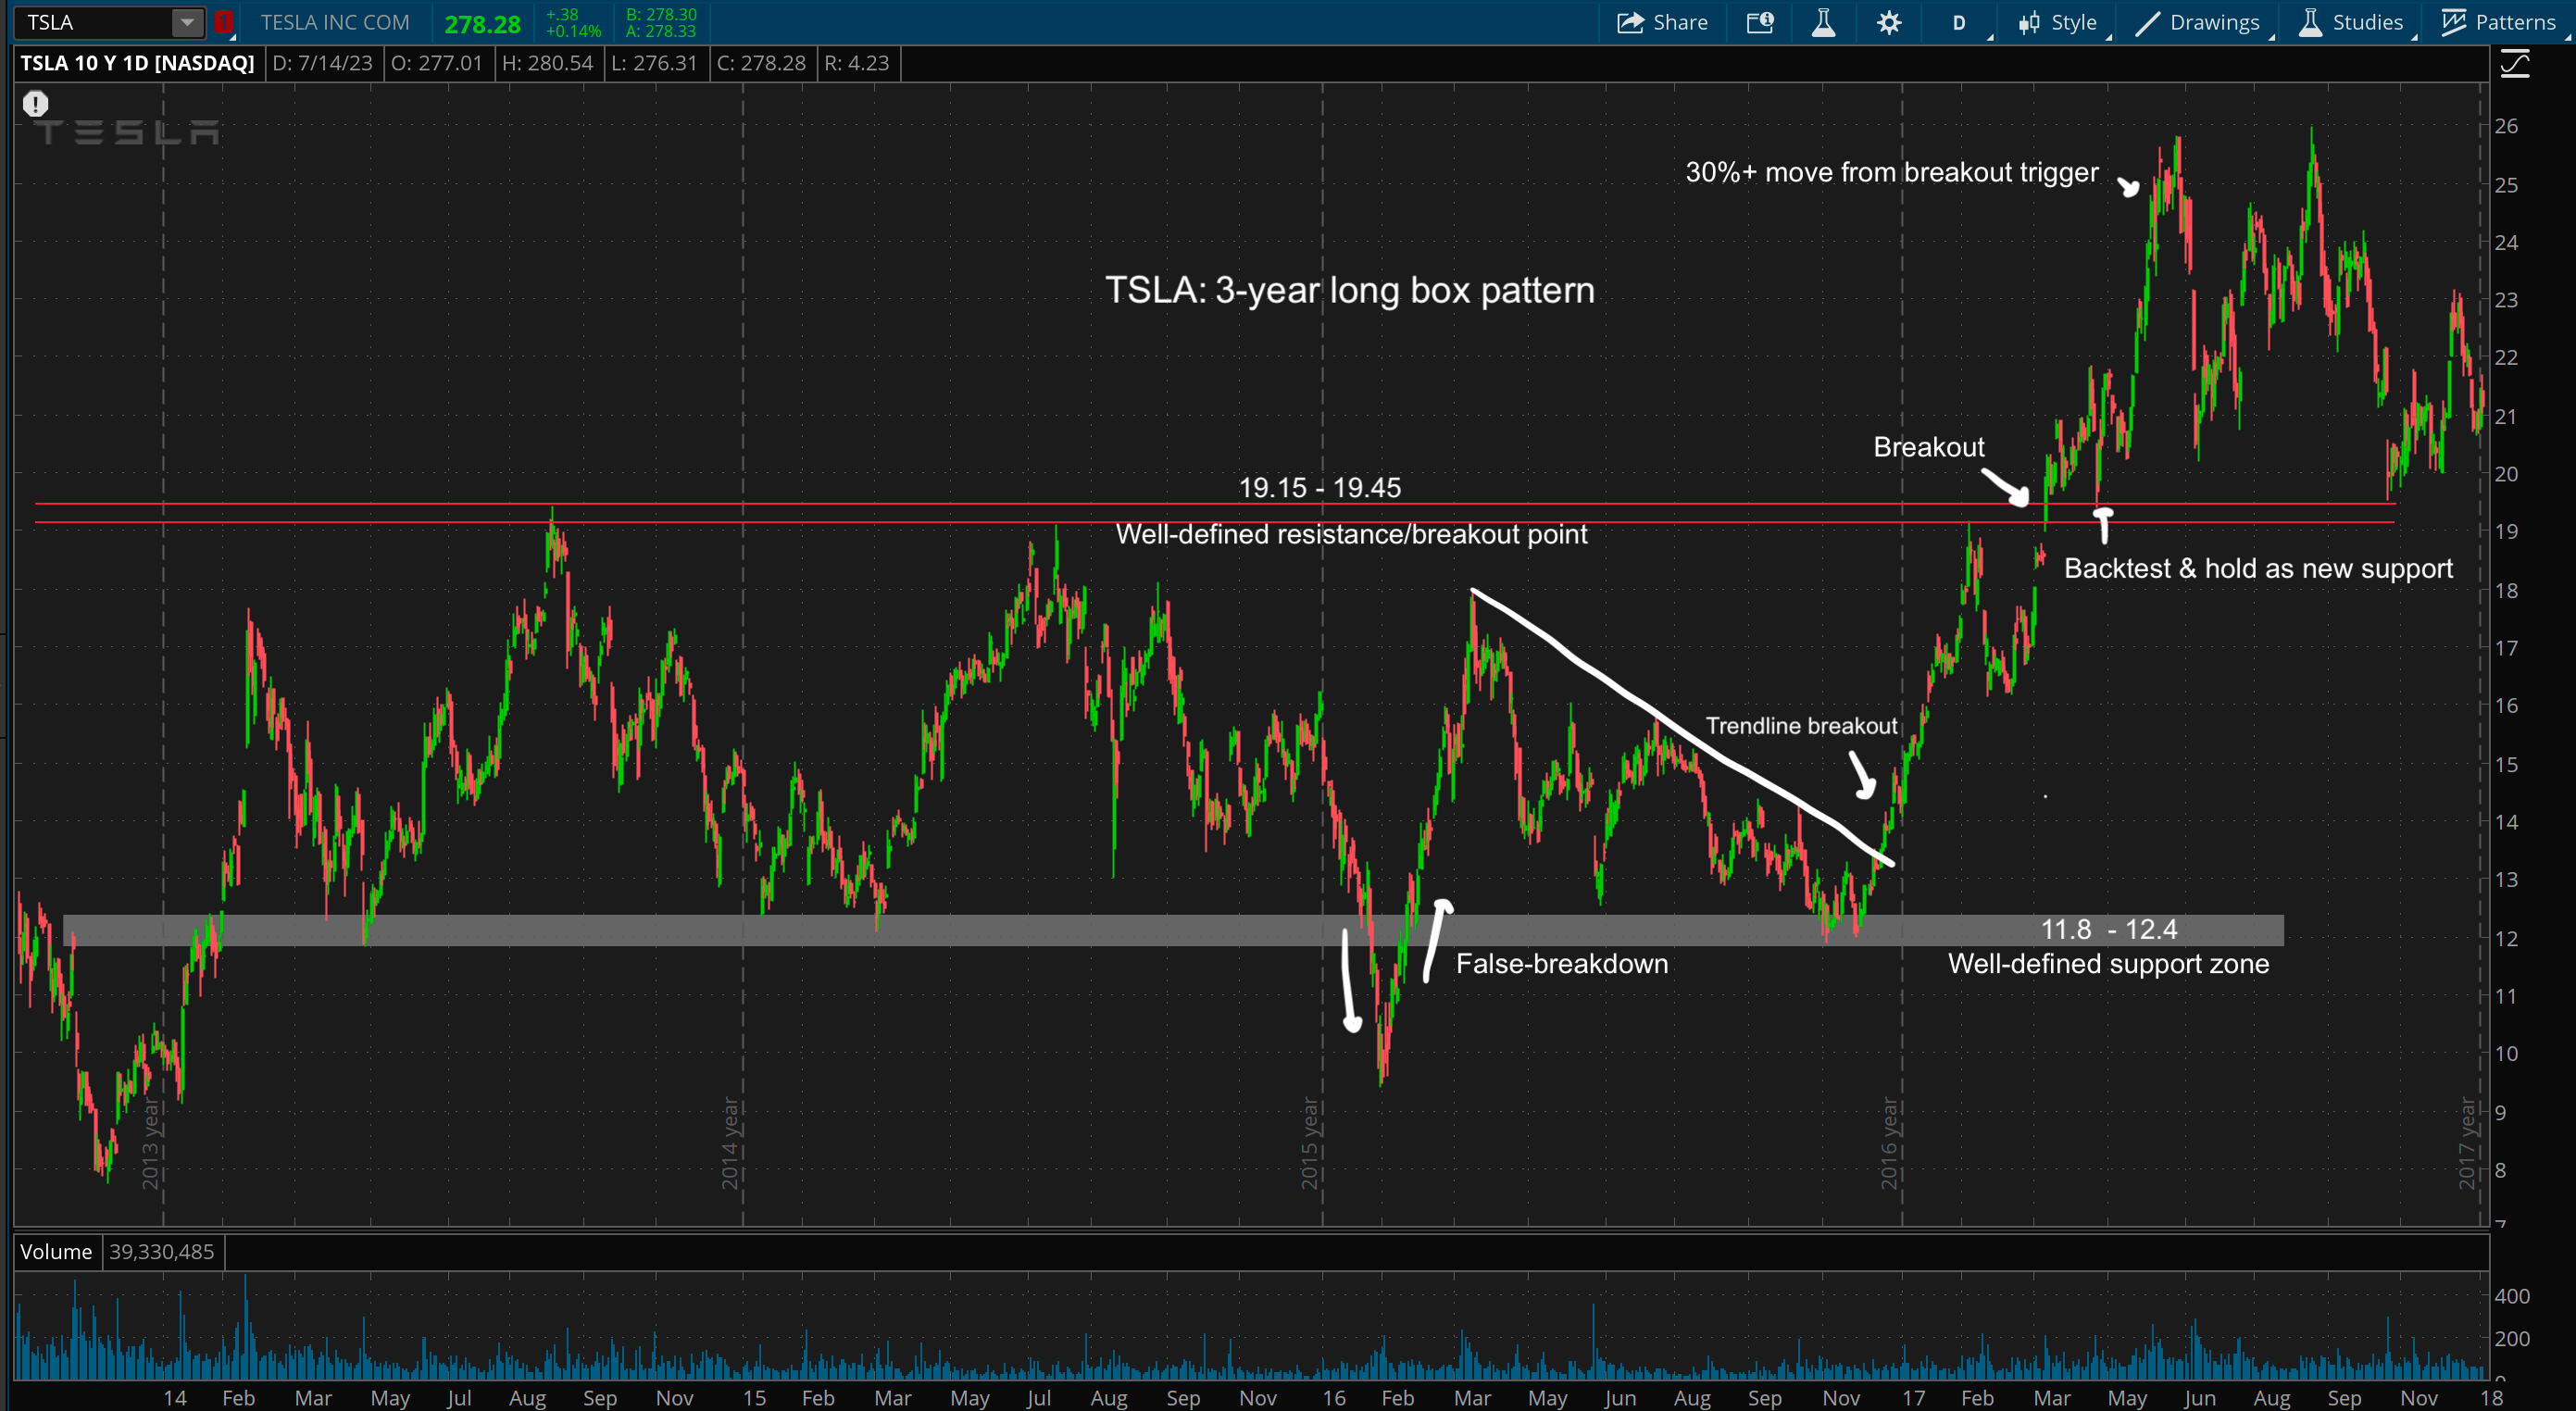
Tesla (TSLA) is a stock that has a few great historical examples. It built out this 3-year long box pattern from 2014 into early 2017, with well-defined support & resistance zones. This setup also incorporated the false-breakdown pattern which readers can learn about here:

The trendline breakout also took place as well which readers can learn about here:

Those two patterns could have gotten traders in ‘low-cheat’ entries which later turned into the larger box/range breakout. Once $TSLA broke out above the $19.15-19.45 key resistance zone and top of the 3-year long range, the breakout was triggered. It had an initial 13% run before pulling back and backtesting the $19.15-19.45 previous resistance as new support. Once it successfully held the backtest, the breakout followed-through for a 30%+ upside move
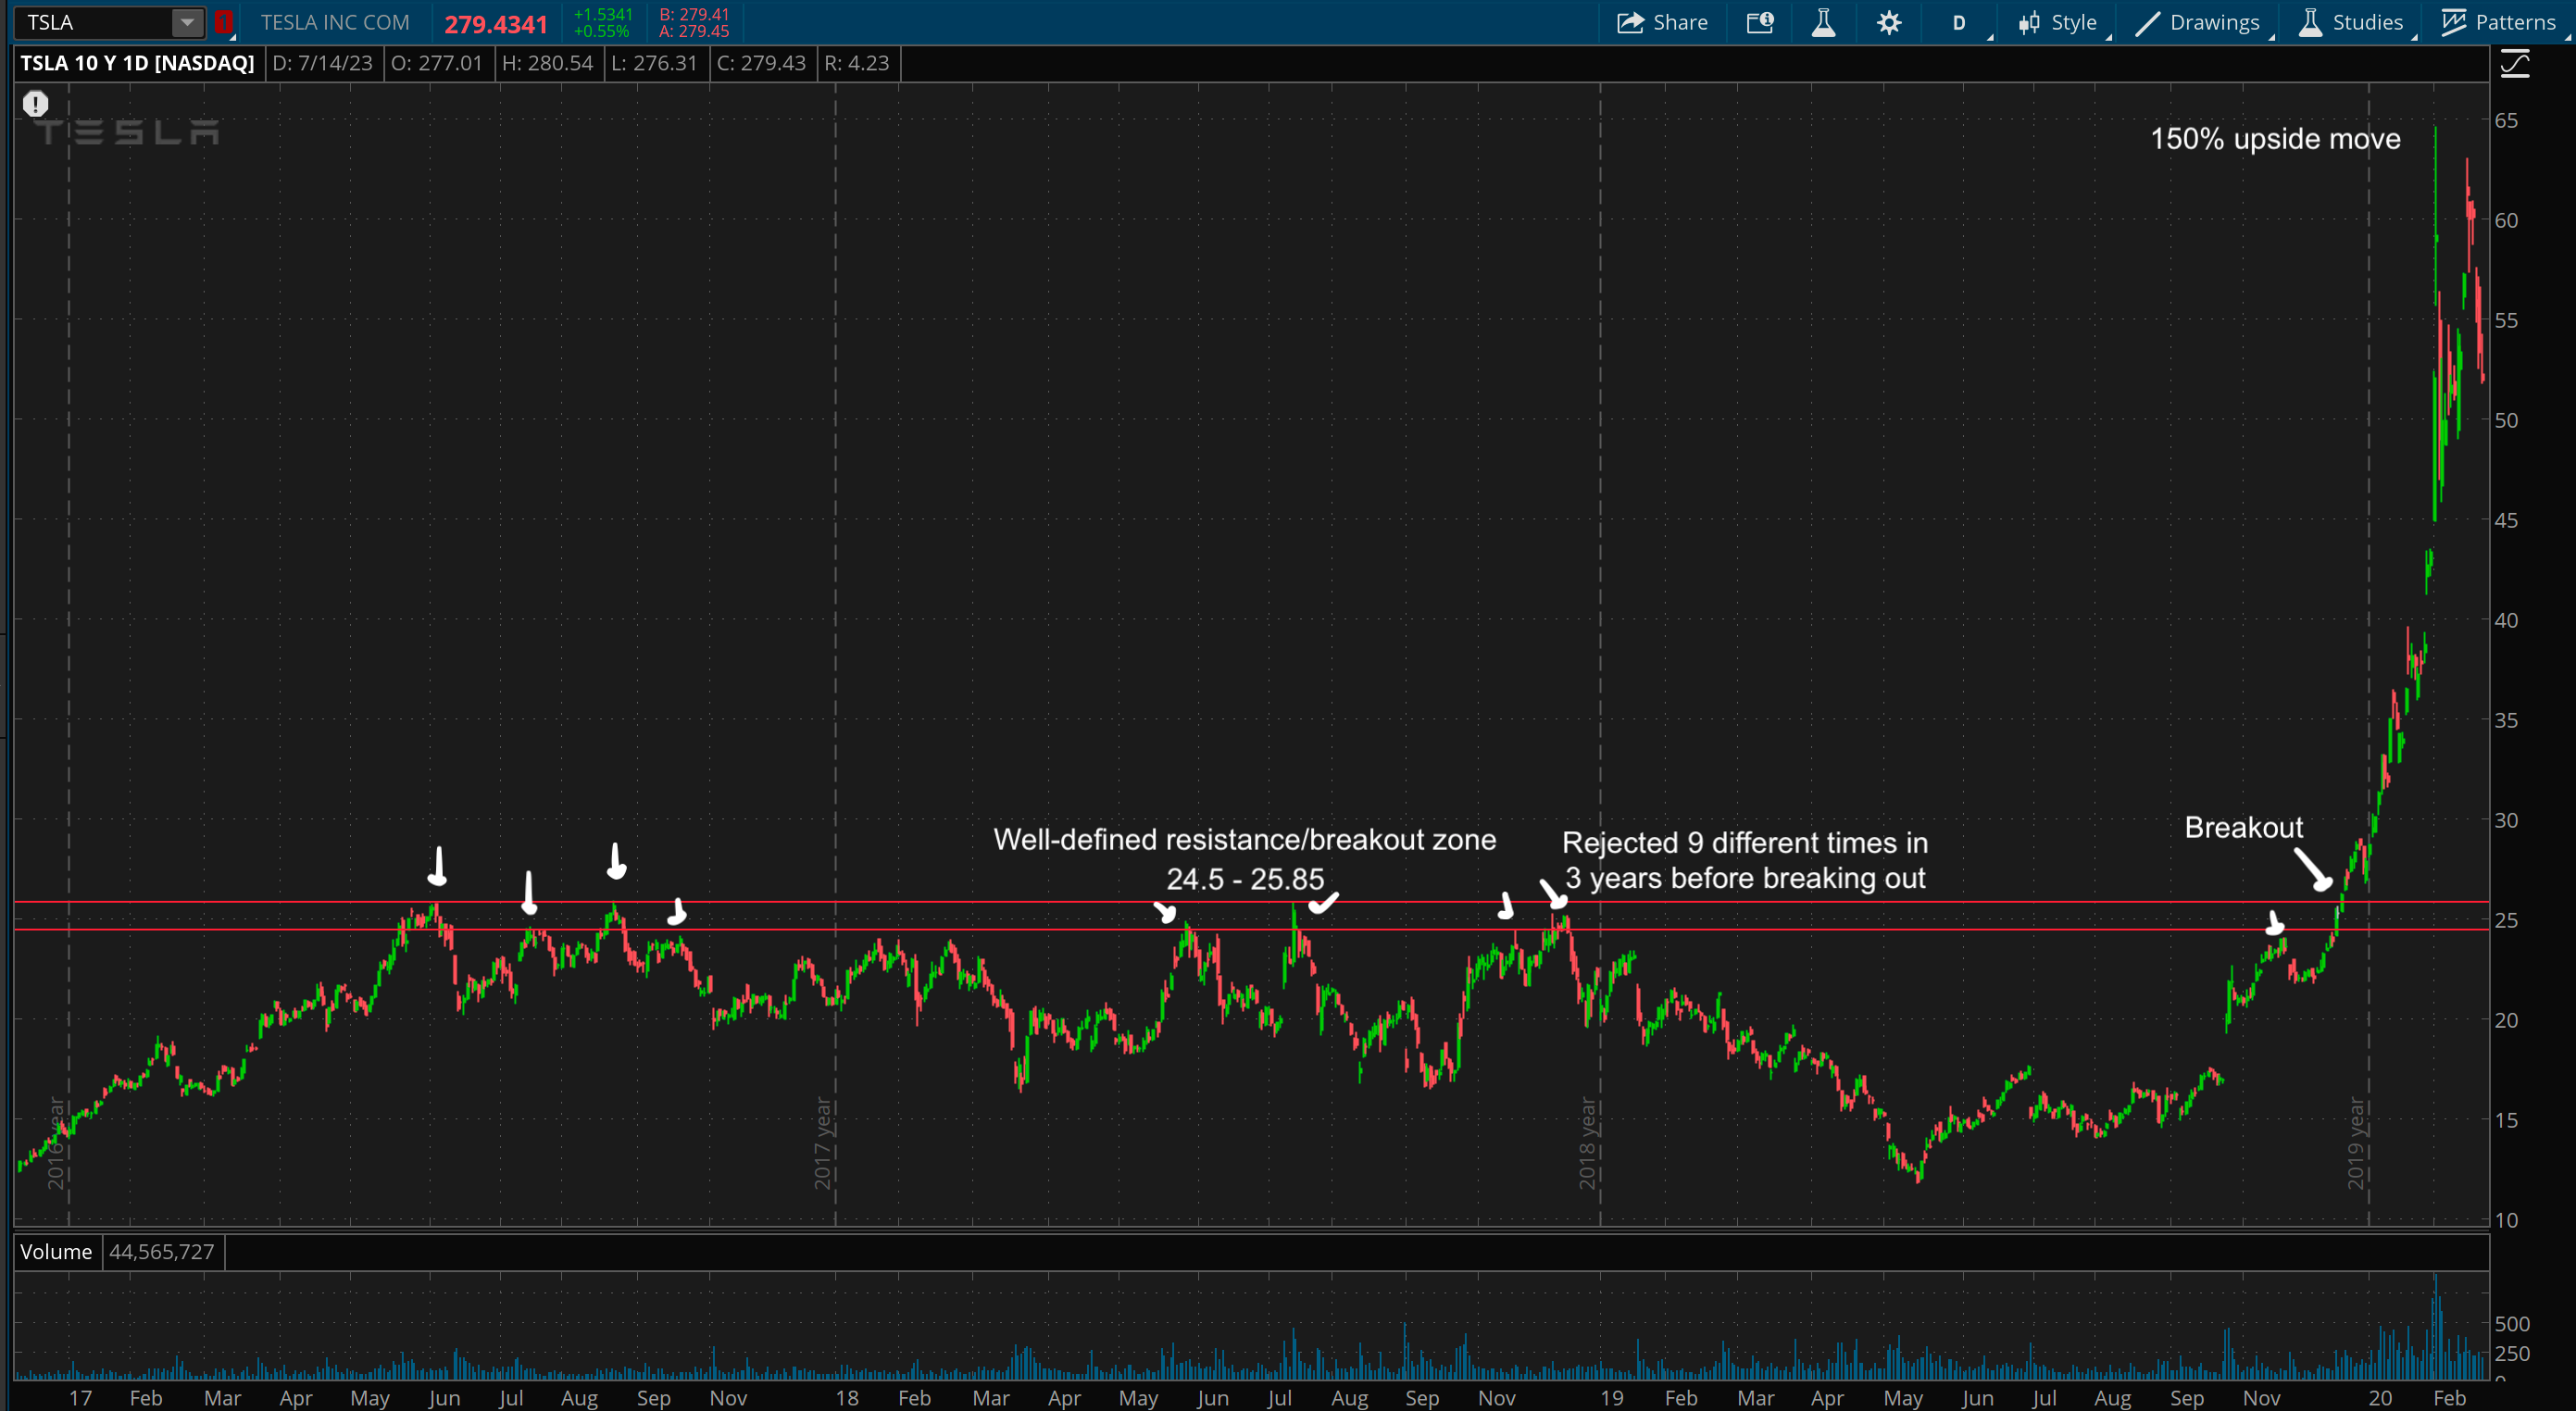
After this breakout, $TSLA then went through another 3-year basing period with well-defined resistance/top of the range at $24.5-25.85. This resistance zone rejected 9 different times in 3 years (well-defined, shows how strong that zone is) before breaking out in late 2019 which turned into a 150% upside move in only 8 weeks.
After this massive breakout move, the 2020 covid crash happened and Tesla stock dropped massively. All investors thought the sky was falling, Tesla was a huge bubble, it already hit all-time highs, etc. While in reality, it was just simple technicals taking place for the stock. Where do you think the stock bottomed?
If you guessed the backtest of the breakout, you are correct. All Tesla did during the 2020 covid crash was retest it’s previous 2019 breakout at $24.5-25.85 as new support, which held and rallied much higher from there.

Tesla stock is a very extreme example, but if a stock breaks out of a box/range and later backtests and holds the breakout zone as new support, following that backtest the stock will often make a higher-high above the previous high from the breakout.

This was a once-in-a-lifetime type move from Tesla stock, but it highlights the power of simple technical analysis with the box/range breakout. The stock was a perfect storm of many things lining up, it consolidated for 6+ years before breaking out, it was heavily shorted, and it had a surprise earnings beat that kickstarted the breakout. If there was not 6+ years of consolidation first, this move would not have been near as explosive. Consolidating for multiple years like that builds up a ton of energy for stocks once they breakout - most of the largest upside moves from stocks have had multiple years of consolidation beforehand.
A recent example of the box/range breakout played out with the Russell 2000 (IWM) index. It consolidated in a box pattern for 3 months with $180-180.5 as the key resistance/top of range. It broke out on June 2nd, 2023 and had a fakeout move back below it in the day following, but followed-through back above on the second breakout attempt. These fakeouts are the cost of doing business when trading breakouts, and as long as you manage tight risk the risk/reward is very favorable once breakouts follow-through. $IWM ran up 5% from the breakout before pulling back and backtesting the $180-180.5 zone as support, which held 2 different times, offering low risk/high reward long entries for a 5%+ move each time.

Zooming out on the same chart, this box/range breakout also resulted on a break above the 1.5 year long descending trendline. It’s common to see these ‘2-for-1’ type setups which incorporate multiple breakout patterns in the same chart. If $IWM holds above the trendline, it is likely headed much higher, and there were multiple opportunities to enter with low-risk long positions. 5% upside moves may not sound like a lot, but it is a huge move for indexes and can turn into multi 100% gains when trading futures or options.

Another recent example is with Inmode (INMD) stock. The stock built out over a year-long consolidation pattern below the $38.7 key resistance/top of range. It had multiple fakeouts above, but only had 1 daily close above the level which is needed to trigger the breakout - the one daily close that it did have was right before earnings, which to manage risk I would wait to enter until after the report (rule #5 above) and if so would have avoided that fakeout. It finally had the breakout and follow-through on July 10th, 2023, which resulted in a 19% move in just 3 days from the breakout.
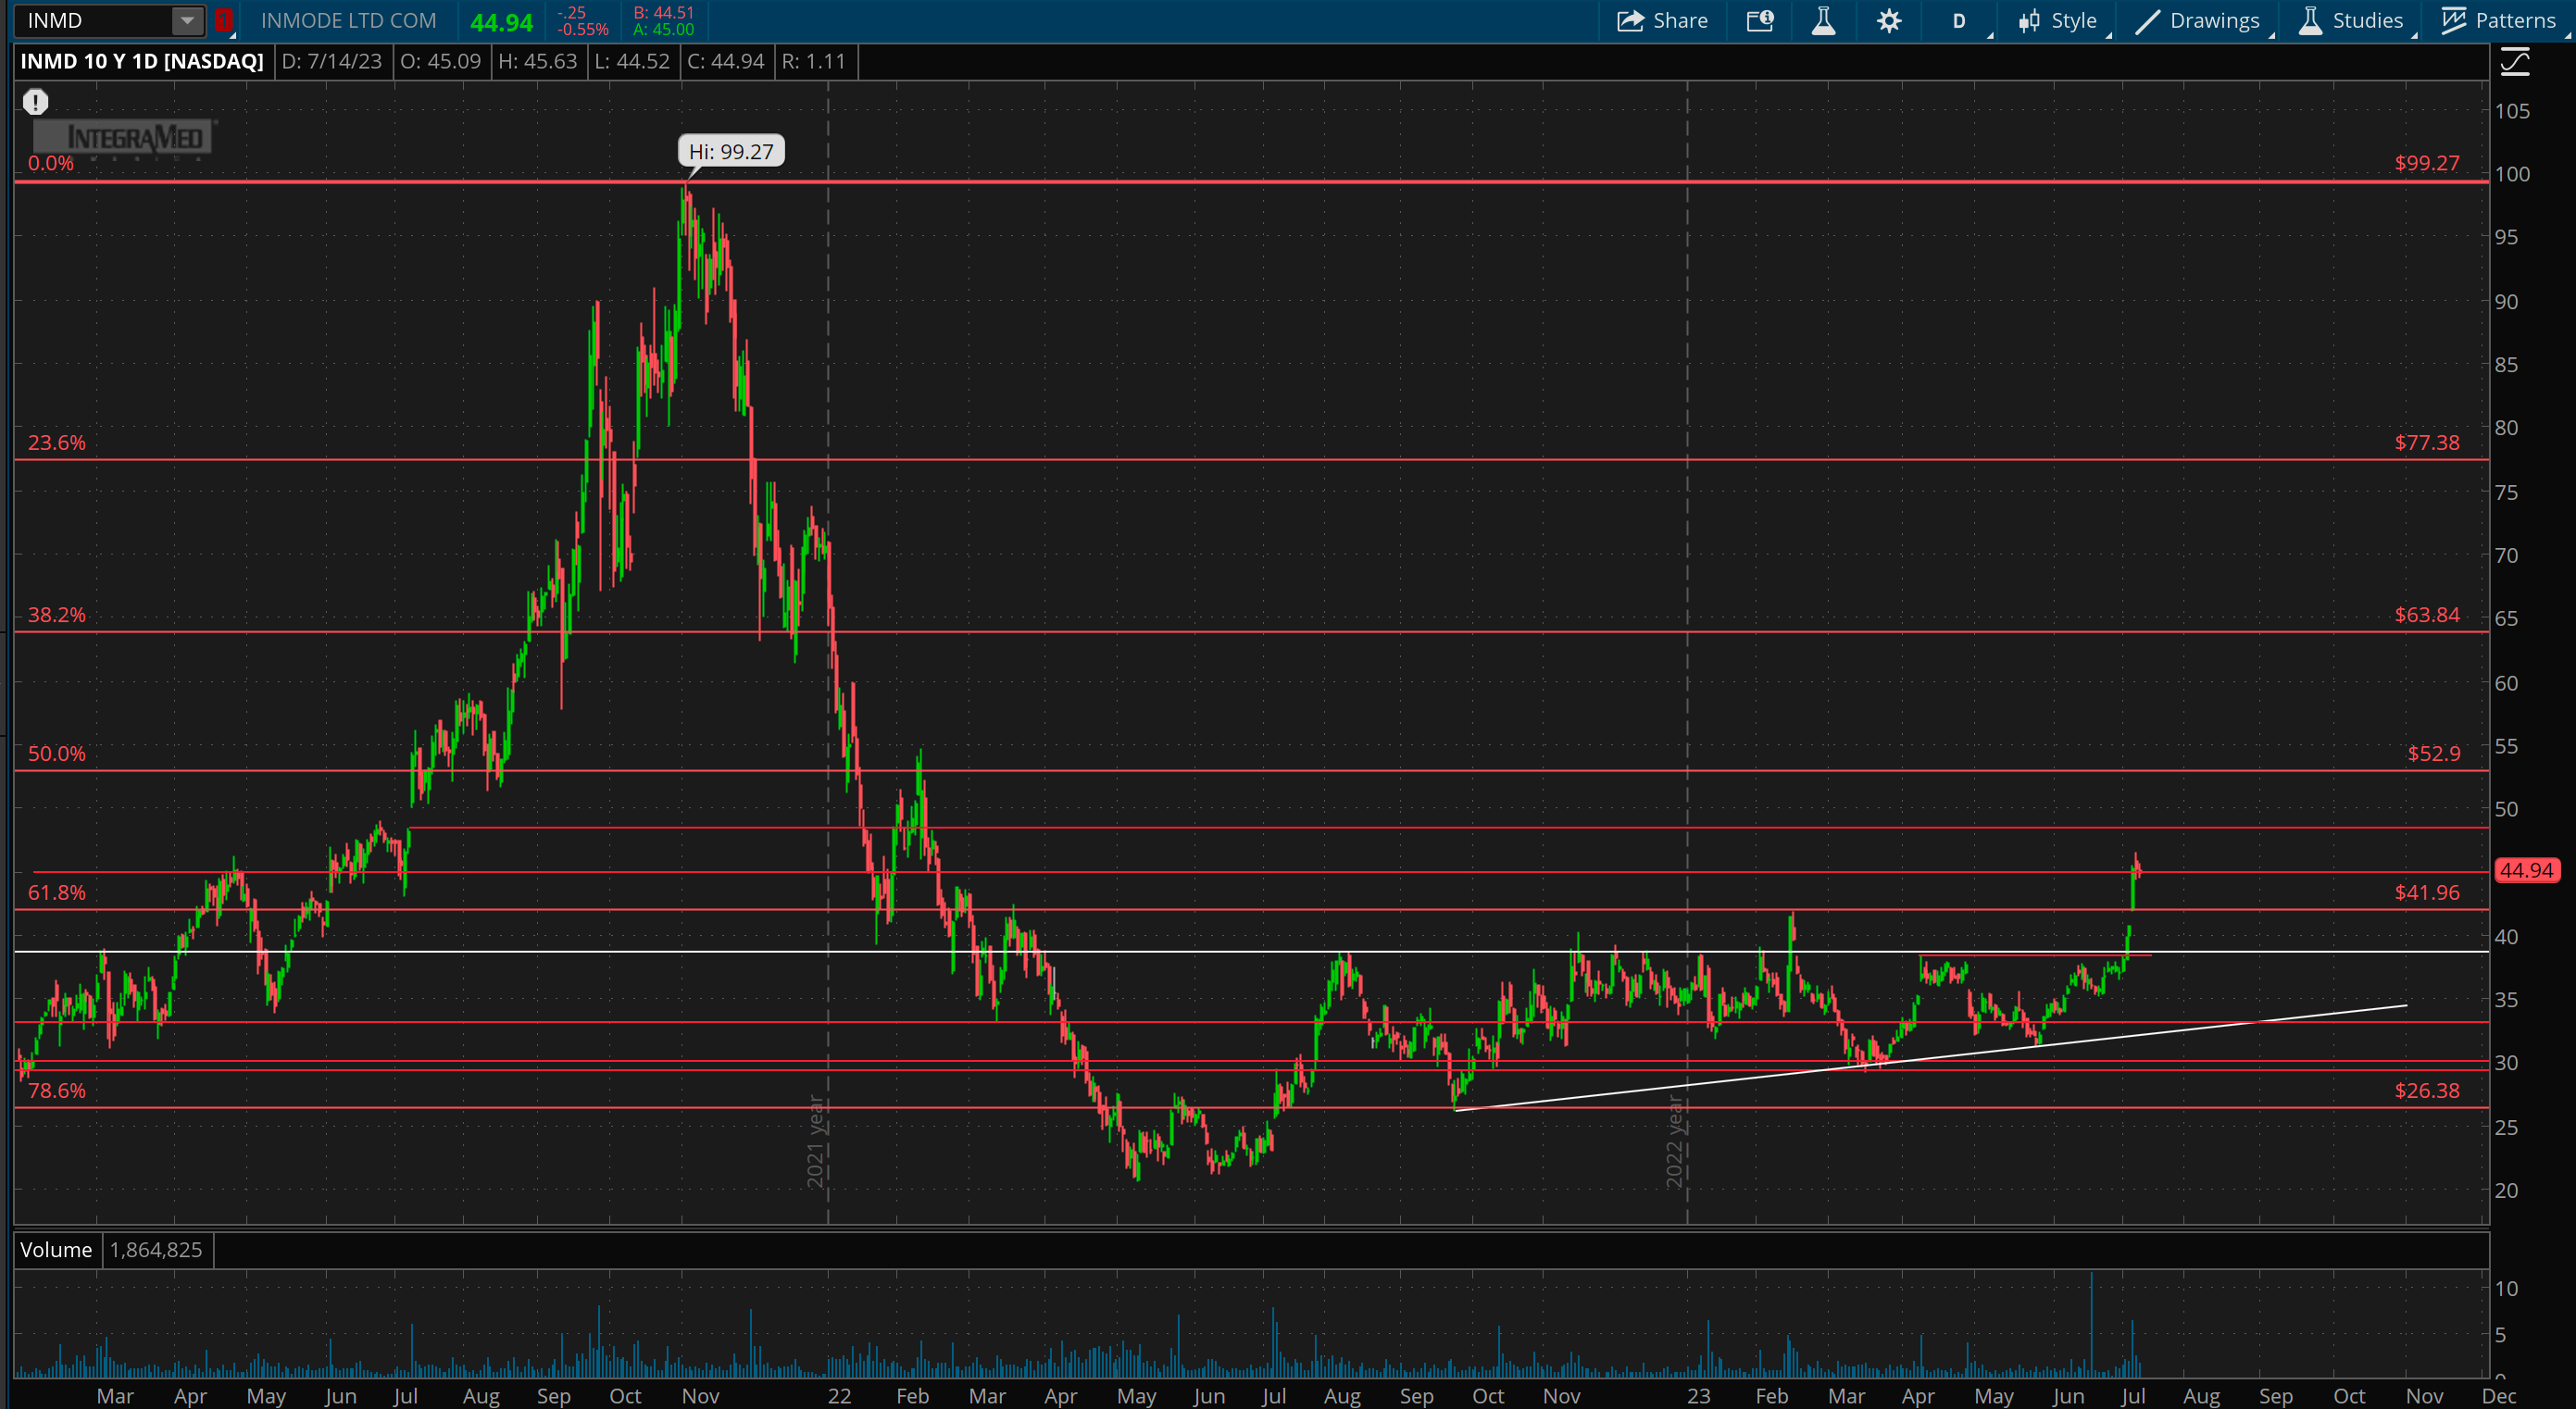
To avoid fakeouts, it also helps to have multiple pivot levels to trade off of. Often, when a real breakout happens it is clear and obvious, and will follow-through higher for most of the day. In $INMD’s case, it had a smaller pivot at $38.4 which had a strong reaction immediately when broken above with follow-through as shown on the 30min chart below.

Axcelis Technologies (ACLS) and Super Micro Computer (SMCI) are examples of the box/range breakout, and is also great case-studies for leaders in bear markets. During the 2022 bear market, $ACLS and $SMCI held up way better than the broad market/indexes. During this time, almost all tech stocks were dropping like a rock and making nonstop new 52-week lows. The semiconductor sector was one of the sectors hit the worst and saw stocks like $AMD and $NVDA fall about 70% each. There were two big outliers in this sector though that held up much better than the rest: $SMCI and $ACLS. If a stock is holding up strongly or even rising during a bear market, that is a major tell and those stocks have a great chance to become leaders once the next bull market starts.
$SMCI and $ACLS have now both become market leaders. (Institutional money is what moves stocks - they have the best research and data. If a stock is holding up well during a bear market, that tells you that institutions are buying and there must be a reason for it). Like I’ve talked about in past newsletters, as a retail trader/investor you don’t have to know the reason why a stock rising, the story is shown on the chart - if a stock is strong - there is a reason for it. Both of SMCI and ACLS went on to have some pretty massive earnings beats - the institutions buying those stocks during the bear market of course saw this ahead of time.
The box/range breakout gave simple and low-risk entries on both of these. $ACLS built out a year-long box pattern (during the 2022 crash) with defined resistance at 82.75-83.75, and broke out above it at the beginning of 2023. Like the majority of these breakouts, it did involve a fakeout but had a weak breakout candle (see rule #1 above), not entering on a weak candle would have helped avoid that fakeout. The breakout then followed-through on the second attempt and had a 60%+ upside move in 2 months


After this 60% run, the stock then went through it’s next basing period and built out a smaller time-frame consolidation with well-defined resistance at 136.4. This lasted about 2 months before breaking above it, successfully backtested as support, and then went on another 40%+ run higher

Box/Range breakout setups like this are really as simple as it gets, buy above the breakout level and have a tight stop loss below - high reward vs low risk every time if entered correctly.
$SMCI had a much choppier, volatile trend and did not offer a low-risk entry point until May 2023 where it had a well-defined resistance at $118.5 and broke out above it on heavy volume. The argument from most traders here would be “the stock is up 160% since the start of 2022, there’s no way it goes higher.” When in reality, this is a simple, A+ risk/reward setup, buy on the break above $118.5, and have a tight stop loss below it. Just 12 trading days later, SMCI followed-through 40% higher and ran up 178% total as of mid-July.

There are endless more examples I could go through with this setup. The important thing to remember is to enter trades correctly, and don’t get FOMO if you missed an entry. To keep risk tight, enter as close to the breakout as possible once it’s obvious that the breakout move is strong. If you enter 5% above the breakout, then your risk drastically increases if the breakout fails - if your average gain is 10%, then you can only afford two losses per win (breakeven) and anything more than that is unprofitable. (For the majority of traders the average gain should be much higher than 10% on swing setups, just using that number as an example).
The great thing about the stock market is there are always endless opportunities. If you missed an entry, just be patient for the next low-risk setup on that stock or the thousand others that are out there. Sometimes it takes a while especially if the market is downtrending or choppy, but there will always be more. My biggest losses, and i’m sure many other traders can relate, have came from FOMO and oversizing. For example, having FOMO on a stock (entering a setup late), that setup then fails which results in a sizable loss (because I entered late), and then oversizing on the next trade to “make the losses back.” The simple way to avoid this? Have strict rules for trades, enter setups correctly, and have tight stop losses if they fail. If a trade doesn’t work out, never have the mindset of “making the losses back.” Think of losses as the cost of doing business. Nobody has a 100% win rate, and some of the best traders in the world have a 30% win rate - it’s all about risk/reward on each trade. If entered the trendline breakout, the box/range breakout, and the false-breakdown setup correctly, your risk/reward will be hugely profitable.
A common question with trading breakouts is “Should you buy a stock before a breakout happens?” My simple answer to that is most of the time, no. The biggest reason that trading these breakouts are very profitable is because of risk management. Often, you will know very quickly whether you’re right or wrong - if you’re wrong you can take a quick 1-3% loss. If you buy before a breakout happens though, when do you know that you’re wrong? Is it a week from now? Is it when you’re down 10% on a position? Those are the biggest issues when trying to “anticipate” a breakout before it happens. Buying at a support or at the bottom of the range of a box setup to potentially lead into a future breakout can be a favorable strategy to where you’re playing tight risk still, but any entry you have should be at a level where you can cut loss very quickly if wrong.