Trading the False-Breakdown Pattern
In this newsletter I will be going over the #1 setup that I look to trade on the indexes: the False-Breakdown Pattern.
The basics of this pattern are simple, and it’s easy to understand why this pattern has such a high success rate. There needs to be a well-defined pivot/major support level at the bottom of a trend, and once that that level breaks the breakdown is triggered. During an uptrend in the market though, breakdowns have a low success rate of following-through. Because of this, smart traders are stalking the potential for that breakdown to fail, which if so will result in a violent move back to the upside. Also, during a downtrend, false-breakdown setups are what often mark swing lows and ultimately market bottoms.
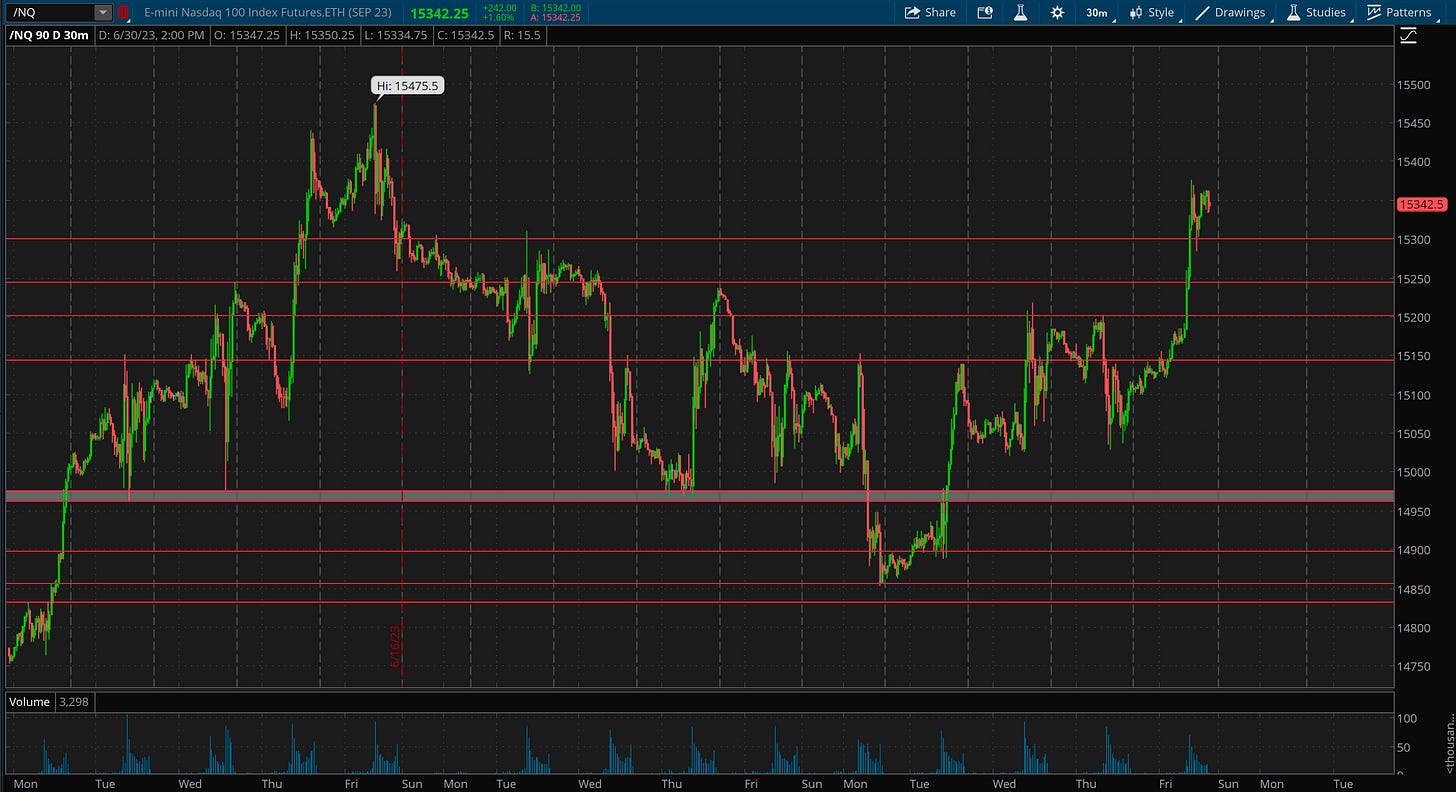
Let’s take a look at a recent example from 6/27/2023 with NQ (Nasdaq Futures):
This built out a 9-day balance/consolidation range with a well-defined downside pivot at 14960-14976, which tested and held 5+ times (shows strength of the zone) before breaking down.
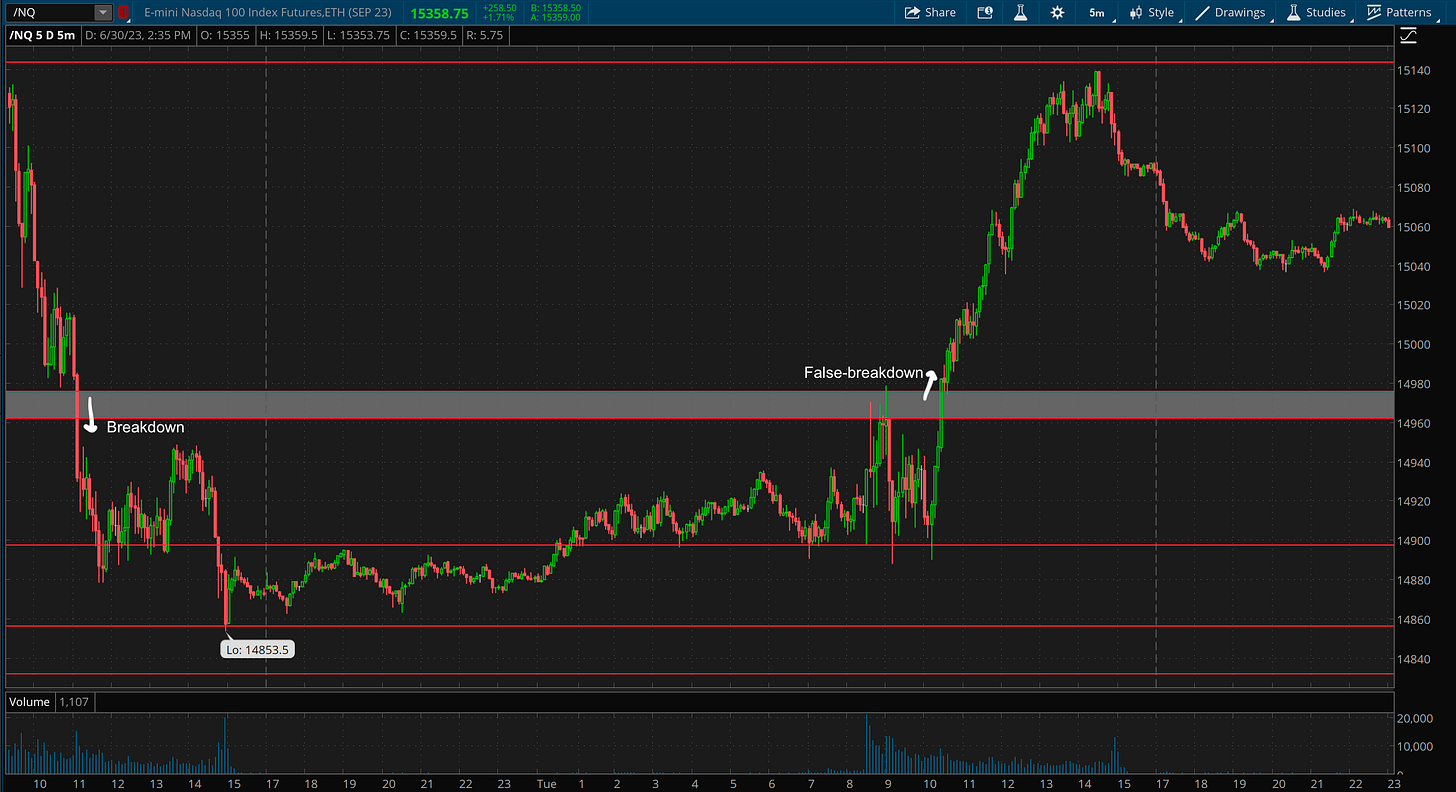
Zooming in to the 5min chart, once the breakdown happens there is a volume spike along with it, which signals stop-losses getting hit on long positions and also traders entering in to short positions
In the day following, it fails to follow-through to the downside, and once that 14960-14976 zone is reclaimed above the false-breakdown is triggered.
Once the false-breakdown is triggered is when you want to be entering long positions. A simple rule to avoid fakeouts is to wait until a 5min candle closes back above the zone, and then to manage risk place a stop loss back below the zone. Depending on your strategy as a trader, you could enter QQQ/NDX calls, long futures (NQ), or long TQQQ shares (3x QQQ index). Great false-breakdown setups like this don’t come around super often so it’s important to take advantage with risk-managed leverage. For example, if you entered long NQ futures on this trigger, you’re risking about 20 points of downside for unlimited upside. In this example, it rallied 160 points intraday after triggering (which is $3200 per NQ contract), while risking just those 20 points ($400 per NQ contract). That is what a ‘Fat Pitch” setup is: high success rate, and also high reward-to-risk ratio.
False-breakdown setups also will often start multi-day or multi-week rallies. For example, the one playing out currently rallied to a high of 400 points, or 2.7%, above the false-breakdown trigger so far, and I am writing this 3 days after it took place. To get that larger move you had to hold through 2 days of chop, but without much sweat since it never retested the zone.
You also want to be watching both the Nasdaq and S&P 500 - finding out which one is leading and which one has the cleaner setup. In this example, the Nasdaq had a cleaner setup and was leading, so that would be that index I would focus my trades on. The S&P futures (ES) had much choppier action but also had a well-defined key support range at 4382-4393. The breakdown wasn’t ‘clean’ like the Nasdaq’s was, as you can see below it had a quick fakeout before falling back below the zone. But once the leading index (Nasdaq) had the false-breakdown trigger, the action on the S&P also followed it with a strong and clean move to the upside. The trend will always be stronger if both indexes are moving the same way. It’s important to identify which one is leading with the cleaner trend which is where you want to focus your trades, and then make sure the other index is following once an important break is made.
Why does the False-Breakdown setup work so well?
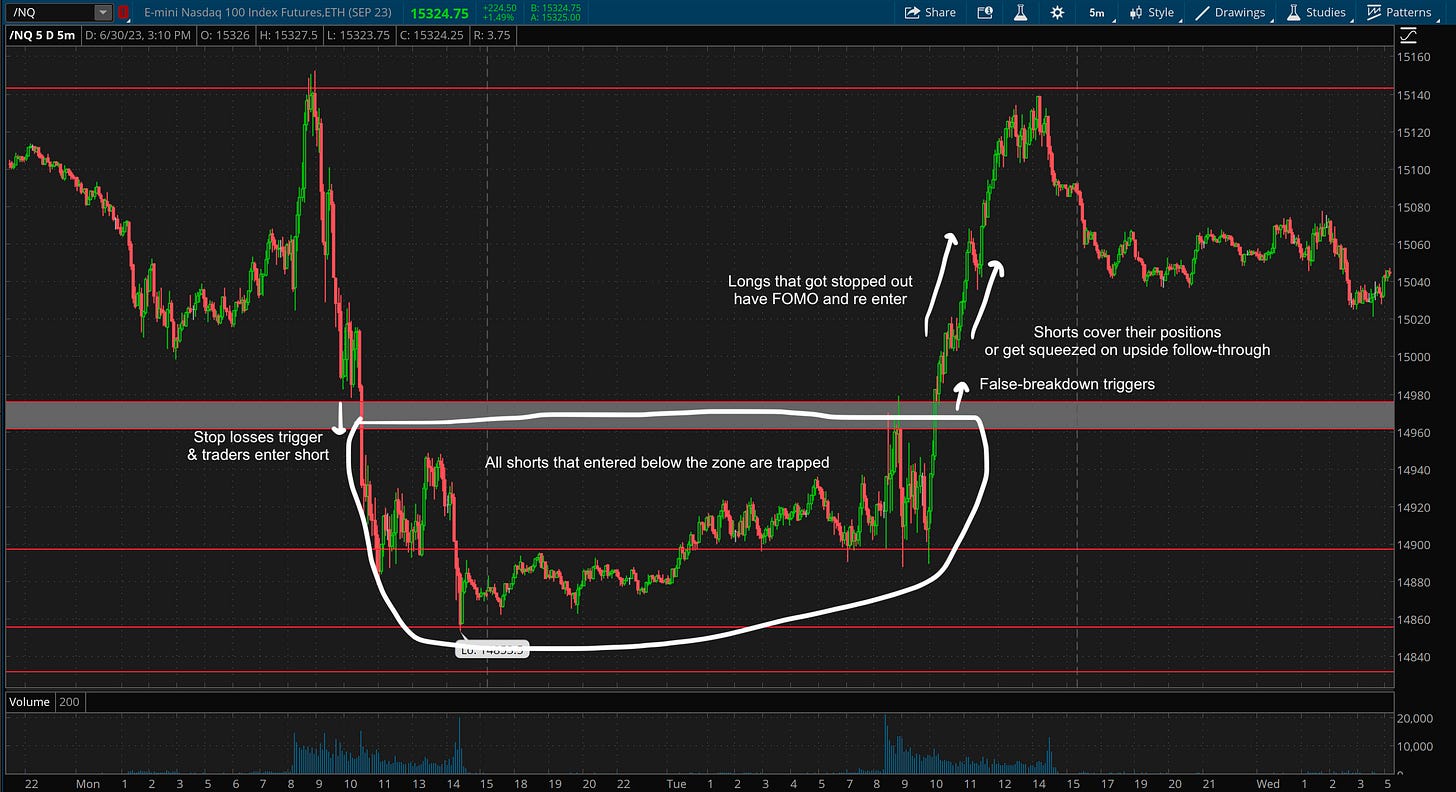
When a breakdown happens below a key pivot, stop losses on longs get triggered and traders also flood into short positions. Once the false-breakdown gets triggered, all of the shorts that shorted the breakdown become trapped, getting squeezed on the way back up and acting as support on dips, fueling the move higher. At the same time, longs that got stopped out have FOMO once they see a violent move higher and re-enter their long positions, also fueling the move higher.
let’s take a look at 2 more examples from the recent bear market:
On 10/13/2022, the market bottomed from the 10-month bear market, and did so off of a large false-breakdown pattern. The S&P 500 Futures (ES) built out this 3-week+ balance/consolidation zone with 3572-3600 as the bottom of the range which had been well tested. September CPI data came in way above expectations on the morning of the 13th, triggering a large sell and breakdown below the range selling all the way down to 3502. The market felt insanely bearish here, making new lows on very ugly data, and I actually shorted on the move down as well.
Once the S&P failed to follow-through to the downside below 3500 (important psych level) that was an important tell and price started to grind higher from the open. Once it broke back above the 3572-3600 zone, a major squeeze took place as all shorts that entered from 3502-3572 became trapped. I recognized my shorting mistake and quickly switched from short to long, and turned the day from a big loser to one of my biggest positive P/L days on the year - knowing how to trade the false-breakdown setup can also protect you by knowing the exact place to set risk on shorts.
This day was one of the most violent moves up I have ever seen. Once ES broke back above 3572-3600 there were a couple 20+ point 5min candles and 10+ point 1min candles which illustrated the sheer strength of the squeeze (thinkorswim only lets me zoom in to the hourly chart for chart data this far back).
From triggering back above 3600, the S&P made a 3.2%+ move higher the rest of the day and the total move for the day was 5.6% from intraday lows to highs. If entered at the false-breakdown trigger (3600), 100+ ES points ($5k+ per contract) could have been made intraday and obviously any short term expiry call options ran an insane amount.
On any same-day move this large, I will always lock in full profits if I’m in a leveraged position - after a move like this some reversion to the mean should be expected next (my usual trading style is to trim and lock in some profits on the way up while raising stop loss to breakeven). But a massive false-breakdown trigger like this should give the idea that the trend has changed until proven otherwise, and to be on the lookout for the next low-risk entry to potentially ride the move higher.
In this instance, it didn’t take long to get that next entry opportunity, as in the day following ES came all the way back down and retested the 3572-3600 zone as support once again. This was a very simple high R/R re-entry opportunity to enter long off the zone again - risking 28 points on the downside (below 3572 would be stop loss) for unlimited upside. If the move is strong, after a backtest, it is likely to move higher than the previous high that was made (in this case it ran up to 3775 vs the previous high of 3730). Once again, rinse and repeat, after another large move lock in profits on the way up and then wait on the next low-risk entry opportunity.
In this case, ES built out a bullflag for the rest of the week, and once the flag broke out that was the next low risk entry opportunity. Enter on the break, set stop loss to even or in profit once it starts working, and ride the move higher while locking in some profit. On this 3rd entry opportunity it ran another 80 points before pulling back.
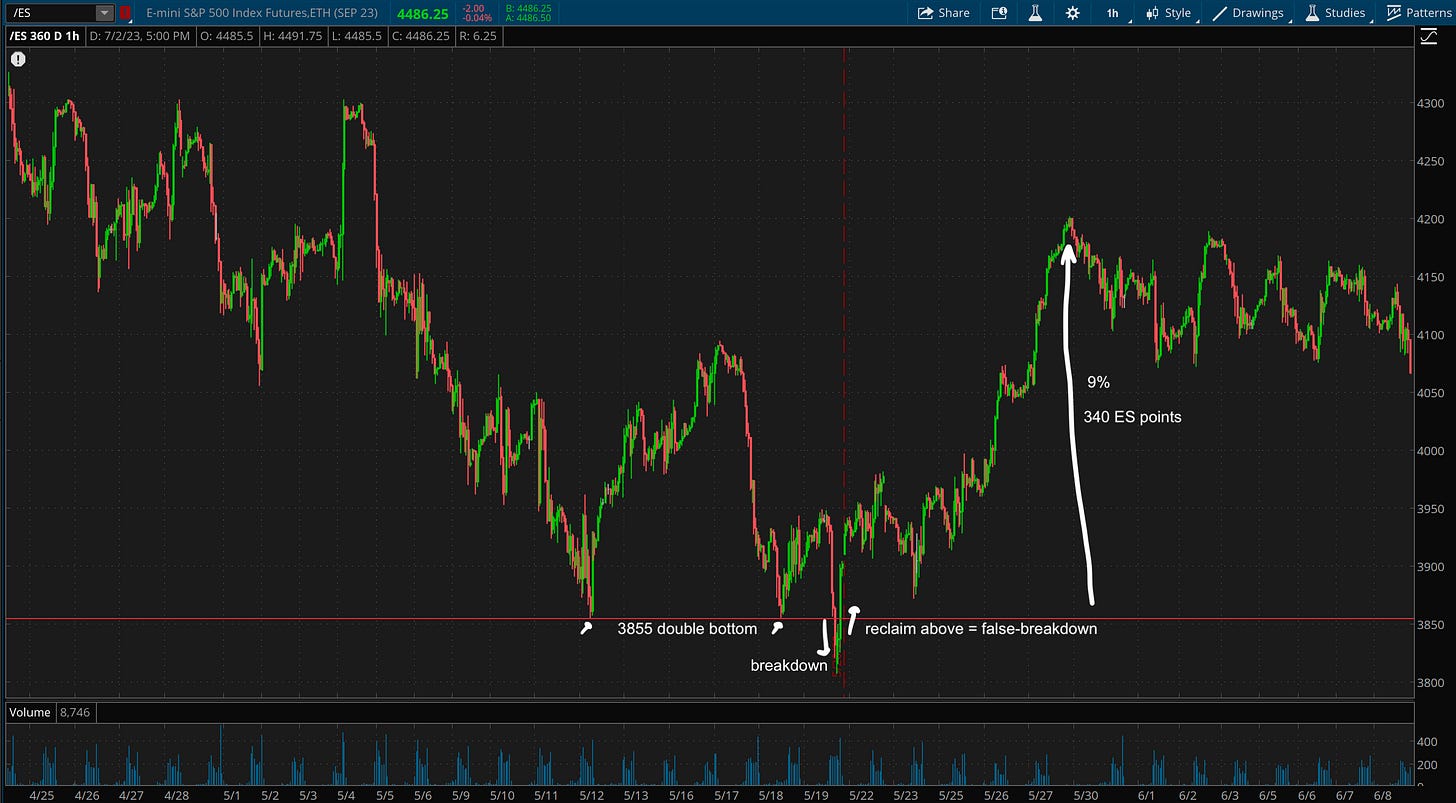
On 5/20/2022, the S&P had just experienced a 17%+ decline in about a month and a half and market sentiment was as negative as it gets. A couple days before, ES attempted to put in a double bottom off the key 3855 pivot, saw a decent bounce before failing and breaking below the 3855 pivot on the morning of the 20th.
This triggered the breakdown and what looked to be the start of a leg lower, but it found support mid-day near 3800, consolidated for a couple hours, and then saw a strong rally in the last 2 hours of the session which triggered the false-breakdown back above 3855. In just the final 2 hours of the trading day, it rallied 2.1% total and 1.3%/ 50 ES points from the false-breakdown trigger at 3855.
The S&P rallied another 2% higher in the day following, and from 5/20 to 5/31 ran up 9% total (just 8 trading days). That move was also about 345 ES points from 3855 to 4200 which would be $17,250 profit per each ES contract. (Myself and 99.99% of traders never would have caught that full move. I likely would have been out of most of my position on the 2% move higher in the day following, raised stop loss, and then get stopped out on the rest on that 3rd day pullback). But this shows how powerful the false-breakdown setup is for those who focus on catching larger trends.
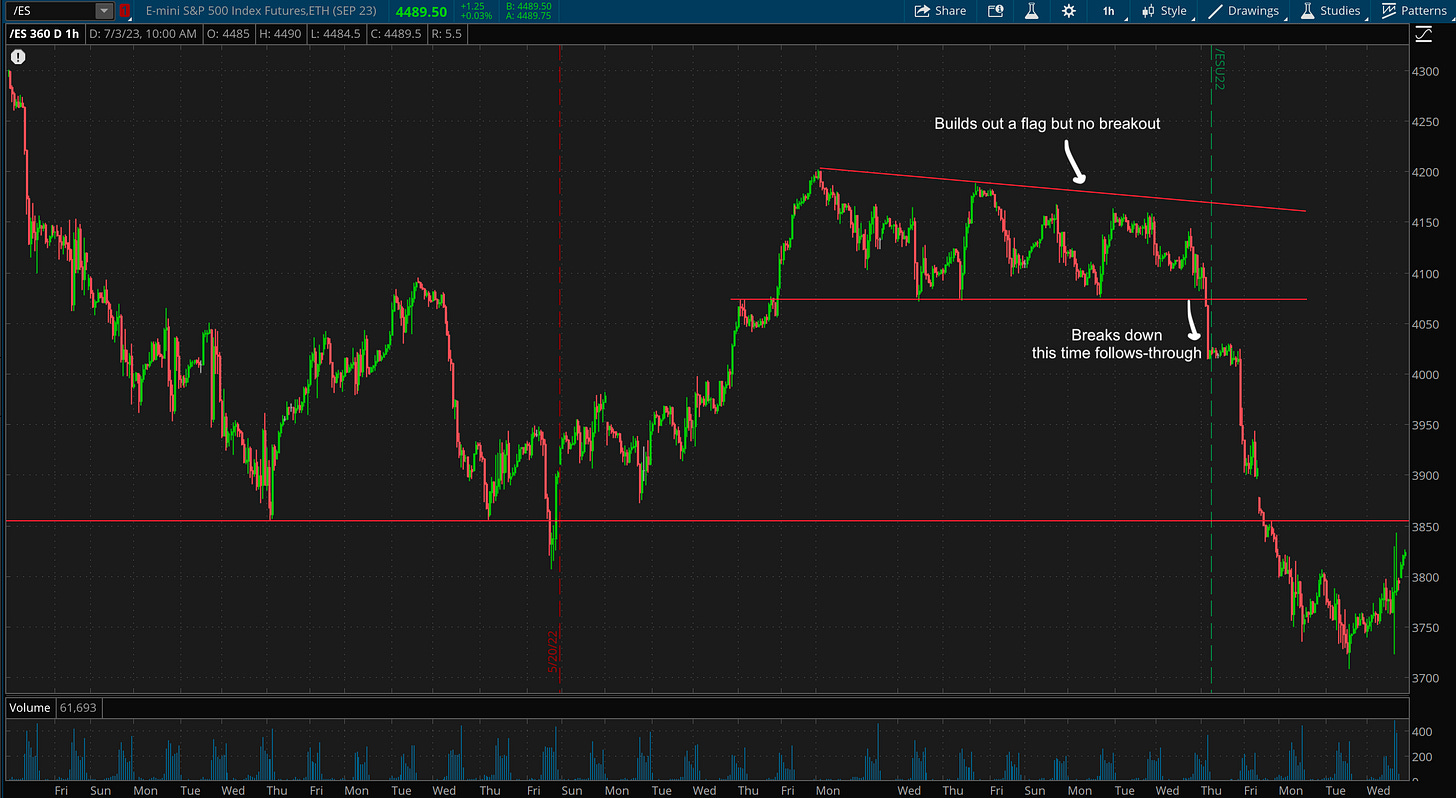
After this move it built out a bullflag which i’d be watching for a breakout and leg higher for a possible low-risk entry, though it never did so and ended up breaking down. No false-breakdown that time around which turned the trend back to bearish for the market once again.
The above examples showed are larger time frames, have an obvious pivot, and what I’d call ‘fat pitch’ setups. Though false-breakdowns happen commonly on smaller time frames and offer tradeable setups such as the one shown below. This built a support range at 4120.5-4125.5, had a strong rally off of there, before a large sell that broke down from the range. It failed to follow-through below and once it recovered back above 4125.5 it triggered a 0.9%/37 point afternoon rally, all in the same day.
Especially with intraday trading on the indexes, it’s crucial to sit on the sidelines until the right setup comes to you. A lot of moves are random and there’s often manipulation with intraday action, so it’s important to master just a few different setups, and stay on the sidelines until those setups come to you.


